Reversal in Trading
A reversal is a sustained change from an established price trend. Learn how swing breaks, opposite structure, timeframe, and false signals affect the label.
A reversal in trading is a sustained change from an established price trend to the opposite direction on a stated timeframe. A bullish reversal replaces a downtrend with rising structure; a bearish reversal replaces an uptrend with falling structure. One countertrend move or boundary break is not necessarily enough.
Reversal is usually recognized in stages and partly in hindsight. More evidence can reduce premature labels, but it also delays recognition and changes the available execution price.
Key Takeaways
- A reversal requires a prior trend; without one, price may simply be leaving a range.
- The first break of a swing point weakens the old structure but may lead to a pullback, range, or false break.
- Opposite-direction swing structure provides stronger evidence than one candle or indicator signal.
- “Confirmation” has no universal meaning; the exact price, time, and follow-through rule must be stated.
- A reversal on one interval can remain a countertrend move on a longer interval.
- Chart evidence does not establish valuation, business quality, or a suitable trade.
How a Reversal Develops
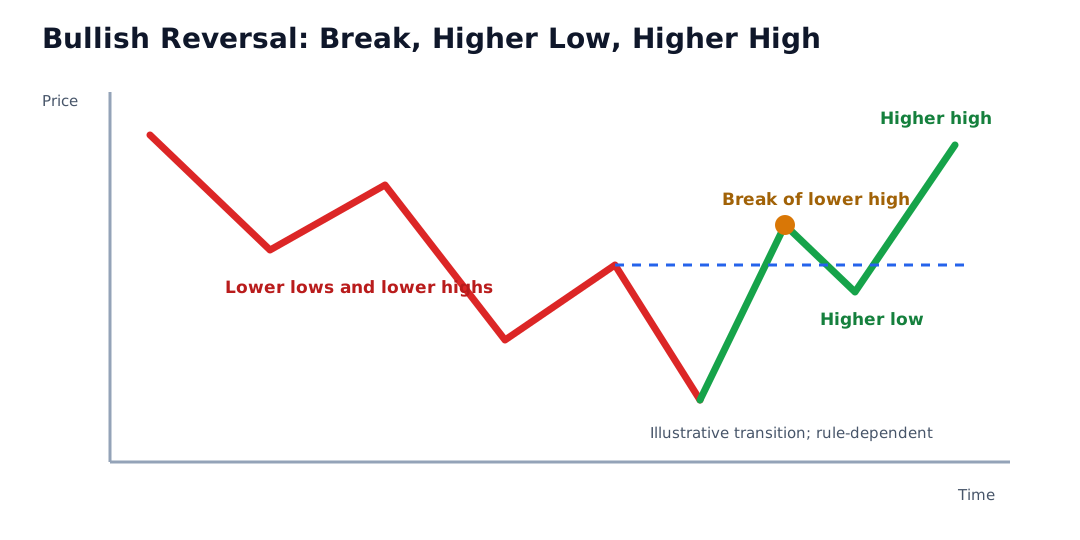
A common structural sequence has four stages:
- Prior trend: Meaningful highs and lows progress in one direction.
- Loss of progress: The trend fails to extend or momentum slows.
- Structural break: Price crosses a swing point that defined the prior trend.
- Opposite structure: A higher low and higher high develop after a downtrend, or a lower high and lower low develop after an uptrend.
This is a framework, not a universal law. Some markets gap abruptly after new information; others spend months in a range before a new direction becomes visible.
Worked Example: Bullish Reversal
Assume a daily downtrend contains:
- lower high at $108
- latest lower low at $92
- pre-declared initial break rule: daily close above $108
Price then follows this path:
| Event | Price | Interpretation |
|---|---|---|
| Close above prior lower high | $110 | Old downtrend structure weakens |
| Pullback low | $101 | Potential higher low above $92 |
| Later high | $115 | Higher high above the $108 reference |
Under a method requiring a broken lower high, a higher low, and a higher high, the $115 event completes the selected bullish-reversal rule.
The tradeoff is delay. A hypothetical purchase at the exact $92 low assumes the turning point was known before later bars existed. A rule-based entry after the $110 break or $115 higher high uses more available evidence but a different price and risk profile.
The pattern can still fail. Price may fall below $101, return below $92, or gap lower after new information.
Bullish vs. Bearish Reversal Evidence
| Stage | Bullish reversal after downtrend | Bearish reversal after uptrend |
|---|---|---|
| Prior structure | Lower highs and lower lows | Higher highs and higher lows |
| Initial weakening | Failed new low or break above lower high | Failed new high or break below higher low |
| Opposite swing | Higher low | Lower high |
| Follow-through | Higher high | Lower low |
| Common failure | Return below new higher low or old low | Return above new lower high or old high |
The table describes a swing-based method. Indicator, moving-average, or pattern-based methods can use different rules and should disclose them.
Candidate, Transition, and Confirmed Under a Rule
| Label | Evidence available | Main uncertainty |
|---|---|---|
| Reversal candidate | Prior trend stalls or countertrend move begins | Old trend may resume |
| Structural transition | Key swing point breaks | Price may enter a range |
| Reversal under selected rule | Opposite swing sequence or other pre-defined condition occurs | New trend can still fail |
| Failed reversal | Price violates the stated failure condition | Old trend or another range may develop |
The phrase “confirmed reversal” means only that a selected historical rule was satisfied. It does not mean that future price is certain.
Reversal vs. Similar Terms
| Concept | What it describes | Key distinction |
|---|---|---|
| Reversal | Sustained change in trend direction | Replaces the prior structure |
| Pullback | Temporary countertrend move | Prior trend later resumes |
| Breakout | Crossing of a pre-defined boundary | One event that may continue, reverse, or fail |
| Market Correction | Decline from a recent peak | Drawdown concept, not necessarily a trend change |
| Consolidation | Sideways price behavior | New direction may not yet exist |
A breakout can begin a reversal, continue the old trend, or fail. Treating the first boundary crossing as the complete directional change collapses different stages.
Recognition Delay and Look-Ahead Bias
A swing high or low generally requires later prices before it can be recognized as a local extreme. A method that buys a bullish reversal at the exact lowest tick or sells a bearish reversal at the exact highest tick is not realistic unless an executable rule generated that order in real time.
For every event, store:
- extreme timestamp
- confirmation timestamp
- signal timestamp
- order timestamp
- fill and transaction cost
This is especially important when historical charts make the turning point look obvious.
Timeframe Conflict
Suppose an hourly downtrend changes to an hourly uptrend while the daily chart still shows lower highs and lower lows. The hourly event is a bullish reversal on that interval and a countertrend rally on the daily interval.
A clear note identifies:
- short, intermediate, and long observation windows
- the swing rule for each
- which timeframe controls the decision
- what cross-timeframe conflict changes
No timeframe is automatically correct for every purpose.
Other Evidence
Volume
Higher activity around a structural break can show participation relative to a defined baseline. It does not prove buyer or seller intent or ensure follow-through.
Indicators
Momentum divergence, moving-average crosses, or oscillator changes can precede or follow a price reversal. Their parameters and signal rules must be fixed, and correlated indicators should not be counted as independent proof.
Fundamental or Event Information
Earnings, financing, policy, economic data, or legal developments can change price abruptly. A technical reversal describes the resulting price structure; it does not explain the event’s long-term financial significance.
From Reversal Signal to Execution
Waiting for additional structure can reduce some premature signals but creates later entry. Acting earlier improves the possible price only by accepting more classification uncertainty.
Execution also depends on:
- market, limit, stop, or stop-limit order
- gap between signal and next eligible trade
- bid-ask spread and market depth
- partial fills and fees
- position and maximum loss
- short borrow and margin for bearish trades
The chart line is not a guaranteed fill.
How to Evaluate a Reversal Claim
- Define the prior trend and timeframe.
- List the swing points supporting that trend.
- State the initial weakening or break rule.
- Define the opposite structure or follow-through required.
- State the failure condition and evaluation horizon.
- Record when every swing became observable.
- Separate signal, order, and actual or simulated fill.
- Include failed candidates, ranges, gaps, and costs in testing.
Risks and Common Mistakes
- Declaring a reversal from one countertrend candle.
- Ignoring whether a prior trend existed.
- Selecting the turning point after seeing later prices.
- Calling a swing break certain confirmation.
- Switching timeframe when the signal fails.
- Counting several versions of the same price input as independent evidence.
- Assuming technical change proves fundamental improvement or deterioration.
- Ignoring gaps, spread, liquidity, leverage, and short-sale risk.
Public Source Checks
- CFTC Futures Glossary defines charting and technical-analysis terminology in terms of historical market data.
- CFTC: Commodity Trading Systems Sold on the Internet warns that hypothetical results can omit spread, execution, fee, loss, and margin effects.
- Investor.gov: Types of Orders explains market, limit, and stop-order mechanics.
- Investor.gov: Executing an Order explains why displayed and actual execution prices can differ.
Related Terms
- Market Trend: The directional structure changed by a reversal.
- Pullback: A temporary move that can initially resemble a reversal.
- Uptrend: Higher-high and higher-low structure.
- Downtrend: Lower-high and lower-low structure.
- Breakout: A boundary crossing that may contribute to a reversal rule.
FAQs
What confirms a reversal?
Can a reversal signal fail?
Why not enter at the exact turning point?
Does a chart reversal mean fundamentals changed?
This article provides general chart-reading education, not a market forecast, trading instruction, or personalized investment recommendation.