Golden Cross and Death Cross
A golden cross occurs when a shorter moving average crosses above a longer one; a death cross is the reverse. Both are lagging, parameter-dependent signals.
A golden cross occurs when a shorter-period moving average crosses from below to above a longer-period moving average. A death cross occurs when the shorter average crosses from above to below the longer average. Traders interpret the first as a possible upward-trend signal and the second as a possible downward-trend signal.
The commonly cited 50-day and 200-day simple moving averages are conventions, not part of a universal definition. Crosses can use other windows, frequencies, price fields, and moving-average methods. Because both lines use historical data, the signal is lagging and can appear after much of a move has already occurred.
Key Takeaways
- The signal is the relationship between a defined short and long moving average, not the names 50-day and 200-day by themselves.
- A golden cross is recorded only when the short average moves from at or below the long average to above it; a death cross is the reverse.
- A crossover does not require three stages, confirmation, or a particular market narrative to exist mathematically.
- Confirmation rules can be added, but they create a different strategy that must be specified and tested.
- Crosses lag price, can whipsaw in sideways markets, and depend on data and parameter choices.
- A crossover is not an executable order, valuation conclusion, or guarantee of future return.
- Backtests should include failed signals, trading costs, parameter selection, and later out-of-sample data.
Golden Cross vs. Death Cross
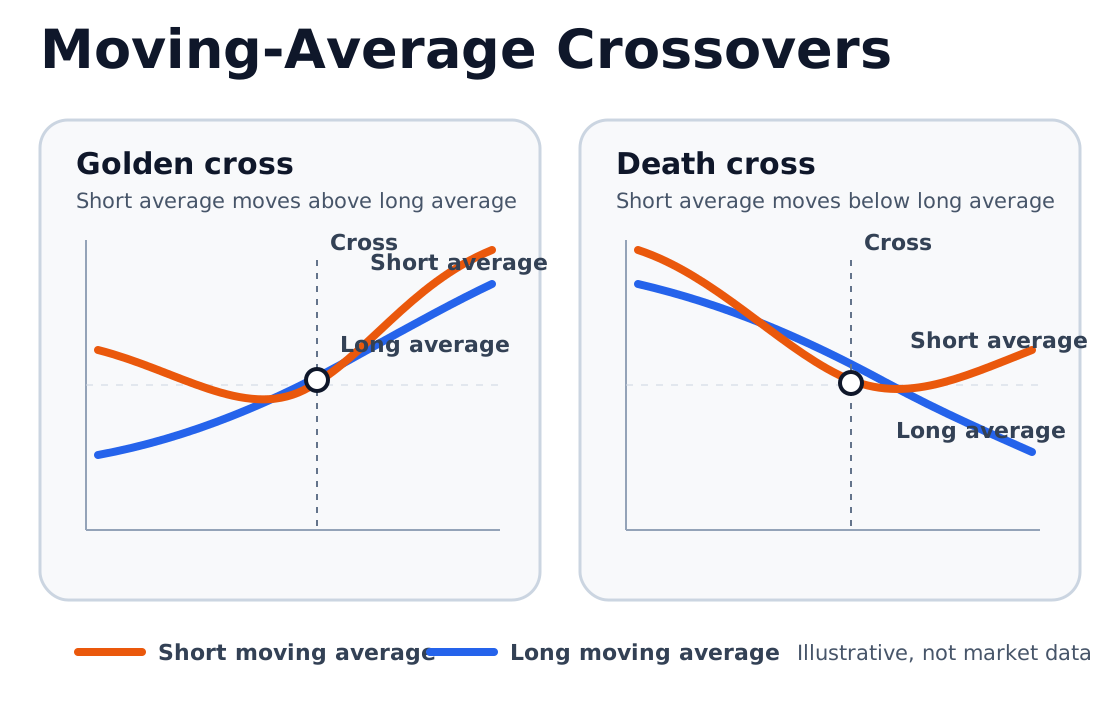
| Feature | Golden cross | Death cross |
|---|---|---|
| Short average before cross | At or below long average | At or above long average |
| Short average after cross | Above long average | Below long average |
| Common interpretation | Possible strengthening upward trend | Possible strengthening downward trend |
| Main risk | Buying after a late advance or false breakout | Selling after a late decline or false breakdown |
| What it proves | The selected recent average rose relative to the longer average | The selected recent average fell relative to the longer average |
The labels do not establish cause. A cross can occur because recent prices changed, because older observations left one of the windows, or because both happened.
Moving-Average Rule
For closing prices (P_t), a simple moving average over (n) periods is:
Let (S_t) be the short average and (L_t) the long average. A simple end-of-period golden-cross rule is:
A death-cross rule is:
This definition resolves an ambiguity that chart commentary often ignores. Merely observing the short average above the long average is a state, not a new cross. The event occurs at the transition.
Worked Example
Assume a simplified system calculates these end-of-day averages:
| Day | 5-day SMA | 20-day SMA | Relationship |
|---|---|---|---|
| Monday | $99.80 | $100.20 | Short below long |
| Tuesday | $100.40 | $100.25 | Short above long |
Tuesday records a golden cross because the 5-day average moved from below the 20-day average to above it.
If a rule enters at Wednesday’s open, Tuesday’s close is not necessarily the trade price. An opening gap, spread, or delayed order can produce a materially different result. If the rule instead assumes execution at Tuesday’s closing price after using that same close to calculate the cross, the backtest may contain look-ahead or unrealistic-execution bias.
Now suppose the 5-day average falls to $100.10 on Wednesday while the 20-day average rises to $100.30. That creates a death cross one day later. The rapid reversal is a whipsaw: two opposing signals occurred without a durable trend.
Why a Cross Lags Price
A Moving Average smooths historical observations. The shorter average reacts faster because each new observation represents a larger share of its window. The longer average changes more slowly.
This lag can be useful when the goal is to ignore small fluctuations and require evidence of persistence. It also creates costs:
- entry can occur well above the price where the move began;
- exit can occur well below a recent peak;
- a sharp reversal can happen before the slow average responds; and
- sideways movement can generate repeated crosses and trading costs.
Reducing the windows increases responsiveness but usually increases sensitivity to noise. Lengthening them smooths more noise but delays the signal further.
Parameter and Data Choices
A reproducible crossover must state:
| Choice | Examples | Why it matters |
|---|---|---|
| Price field | Close, adjusted close, settlement, midpoint | Different fields can cross on different dates |
| Frequency | Intraday, daily, weekly | A 50-period average has a different horizon on each frequency |
| Short and long windows | 20/50, 50/200, 10/40 | Parameters change sensitivity and turnover |
| Average type | Simple, exponential, weighted | Weighting changes the line and crossing date |
| Signal timing | Intraday touch, end-of-period close, next-period confirmation | Determines when the event is known |
| Adjustment | Splits, distributions, futures rolls | Unadjusted discontinuities can create artificial signals |
| Execution rule | Next open, limit order, closing auction | Signal price and realized fill can differ |
The 50/200-day pair is popular for broad daily trend commentary, but popularity does not validate its profitability for every asset, market, or period. Selecting whichever pair looked best in past data creates data-mining risk.
Cross, Confirmation, and Strategy
A crossover is one condition. A trading strategy may add:
- price closing above or below both averages;
- a minimum distance between the averages;
- a waiting period after the cross;
- volume, breadth, or volatility filters;
- a stop, exit cross, or maximum holding period; and
- position sizing and portfolio limits.
Those additions can reduce some false signals while delaying entry or creating different failure modes. They should not be described as inherent stages of every golden or death cross.
A complete rule distinguishes four items:
- Setup: conditions monitored before a cross.
- Signal: the exact crossover event.
- Order: how and when the position is submitted.
- Risk control: position size, invalidation, exit, and maximum loss.
Without the last two, a chart label cannot be evaluated as a real strategy.
How to Test a Crossover Claim
- Define the instrument universe and avoid using only securities that survived.
- Use price data that were available at each historical decision time.
- Specify fields, adjustments, windows, weighting, and initialization.
- Generate the signal without using the execution price before it was available.
- Include spreads, commissions, market impact, financing, borrow costs, and taxes where relevant.
- Compare the strategy with a suitable passive or simpler trend benchmark.
- Reserve later data or different markets for out-of-sample evaluation.
- Report drawdowns, turnover, failed crosses, and time out of the market, not only average return.
- Test reasonable parameter variations rather than publishing only the best pair.
Risks and Limitations
Whipsaw Risk
When price fluctuates around a flat long average, the short average can repeatedly cross in both directions. Losses and costs can accumulate even though no large trend develops.
Late-Signal Risk
The crossover can occur after a substantial rise or fall. A golden cross near a short-term peak or death cross near a trough can produce poor timing.
Regime Risk
A trend-following rule can behave differently in trending, range-bound, high-volatility, low-liquidity, or policy-driven markets. Historical performance from one regime may not transfer.
Data and Implementation Risk
Corporate-action errors, missing observations, time-zone differences, futures-roll methods, and unrealistic fills can change a result. Live orders can also be rejected, delayed, partially filled, or executed away from the signal price.
Portfolio Risk
A correct directional signal can still create an unsuitable position because of leverage, concentration, correlation, currency exposure, or liquidity needs.
Common Mistakes
- Defining every cross as 50-day versus 200-day without stating that it is a convention.
- Saying a golden cross confirms that a downtrend has ended.
- Saying a death cross instructs every investor to sell or short.
- Treating a cross seen intraday as final before the period closes.
- Ignoring adjusted versus unadjusted price history.
- Entering a backtest at a price that was not available after signal calculation.
- Optimizing window lengths on the full historical sample.
- Combining several price-derived indicators and calling them independent evidence.
- Omitting failed signals and transaction costs.
Public Source Checks
- NIST: Moving Average and Smoothing Techniques explains moving-average smoothing and the tradeoff between noise reduction and responsiveness.
- CFTC Futures Glossary defines technical analysis using price, volume, and open-interest patterns.
- Investor.gov: Executing an Order explains why the execution price is not guaranteed to equal the price visible when an order is submitted.
Related Terms
- Moving Average: The rolling smoother used to construct crossover signals.
- Technical Analysis: The broader discipline of defining and testing price, volume, and market-activity rules.
- Bullish: An expectation of higher prices or stronger relative performance.
- Trend Line: A chart line used to describe directional structure without rolling averaging.
- Backtesting: Historical evaluation that must control for future-data leakage, selection bias, and implementation costs.
FAQs
Does a golden cross predict that prices will rise?
Must a golden cross use the 50-day and 200-day averages?
Is a death cross a command to sell?
Can a golden cross and death cross occur close together?
This article provides general financial and technical-analysis education, not a market forecast, trading signal, or personalized investment advice.