Accumulation in Trading
Accumulation is the interpretation that buying absorbs available supply over time. Learn what charts show, what they cannot prove, and how filings differ.
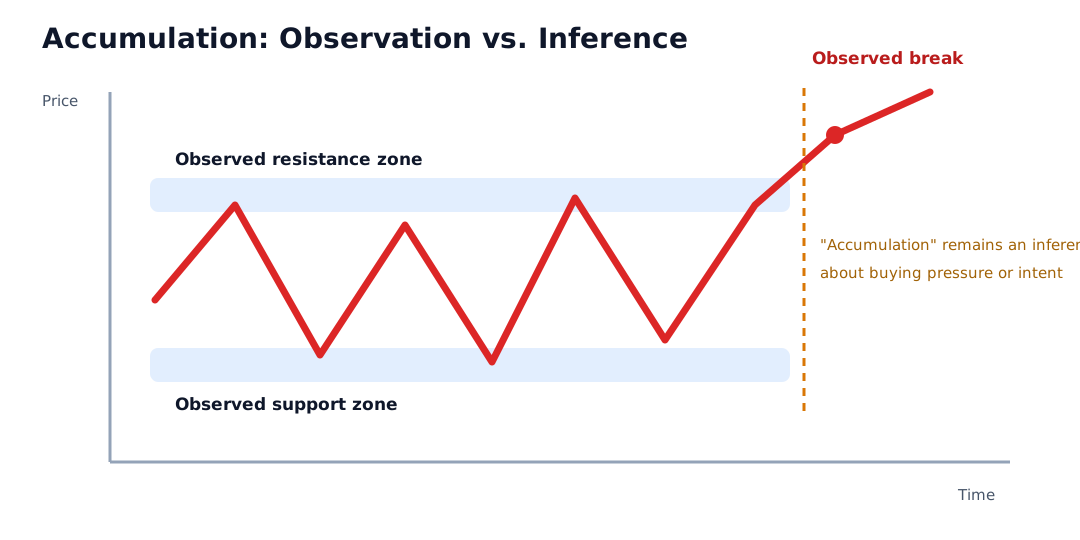
Accumulation in trading is the interpretation that one or more buyers are building positions over time and absorbing available supply. Analysts often apply the label to a range or base after a decline, but public price and volume usually show trading outcomes rather than buyer identity, motive, or future demand.
The most important distinction is between observation and inference. A support reaction, volume increase, or upside break can be measured. Saying that institutions or “smart money” accumulated is a causal claim that requires evidence beyond the chart.
Key Takeaways
- Accumulation describes a buying-pressure hypothesis, not a directly observed chart state.
- The same range can reflect accumulation, distribution, market making, hedging, indecision, or changing liquidity.
- Volume measures completed activity; it does not identify which side was informed or whether a position was newly established.
- An upside breakout resolves a selected boundary rule but does not prove who bought inside the range.
- Form 13F provides delayed quarter-end holdings information for covered managers and securities, not a real-time transaction ledger.
- A presumed accumulation range can fail downward, so evidence, invalidation, execution, and loss risk remain separate.
What Is Observed and What Is Inferred?
| Statement | Type | What supports it |
|---|---|---|
| Price traded between $48 and $52 for 30 sessions | Observation | Timestamped market data |
| Volume was 40% above its 20-day median | Observation | Defined volume field and baseline |
| Closing prices held above $48 | Observation | Consistent close-based rule |
| Buyers absorbed all available supply | Inference | Requires order, venue, or participant evidence |
| Institutions accumulated shares | Participant claim | Requires relevant holdings or transaction evidence |
| Price will rise after the range | Forecast | Requires a tested model; remains uncertain |
Precise wording improves trust. “Price held a support zone on above-median volume” is testable. “Institutions quietly accumulated” is not established by those facts alone.
Worked Example
Assume a stock trades for 30 sessions between:
- support zone: $47.80 to $48.20
- resistance zone: $51.80 to $52.20
- median daily volume over the prior 20 sessions: 1.0 million shares
- average volume on range up-days: 1.4 million shares
- average volume on range down-days: 1.1 million shares
The up-day to baseline volume ratio is:
1.4 million / 1.0 million = 1.40
The down-day ratio is:
1.1 million / 1.0 million = 1.10
Those measurements show more activity on the selected up-days than on the selected down-days. They do not reveal whether the difference came from long-term buyers, short covering, options hedging, market makers, index flows, or a few large transactions.
Suppose the pre-declared breakout rule requires a close at least 0.5% above the $52.20 upper zone:
$52.20 x 1.005 = $52.46, rounded to the nearest cent
A close at $52.70 satisfies that boundary rule. It supports the statement that the range broke upward under the selected method. It still does not prove accumulation caused the move or that the breakout will continue.
A Practical Evidence Ladder
Price and Volume
These are widely available and time-stamped, but participant intent is not directly visible. Volume can be fragmented across venues, and off-exchange or delayed reporting can complicate interpretation.
Order-Book and Trade Data
Quoted depth, order additions, cancellations, and executed trades can provide more detail about market behavior. They still may not identify the ultimate beneficial owner, economic motive, or related hedges across other venues and instruments.
Company and Regulatory Filings
Filings can identify certain positions or ownership changes subject to the applicable reporting framework. They are periodic or event-driven and may cover only specified securities, persons, and reportable interests.
Internal Records
Broker confirmations, order-management records, and account statements can establish activity for the holder of those records. They do not necessarily explain the entire market.
The stronger the claim about identity or intent, the stronger and more direct the evidence should be.
What Form 13F Can and Cannot Show
The SEC describes Form 13F as a holdings report filed by institutional investment managers that meet the applicable requirements. The information table includes specified reportable securities, share amounts, and fair market value as of quarter-end.
Suppose a manager reports 500,000 shares at one quarter-end and 700,000 at the next. The public records show a 200,000-share increase in reported quarter-end holdings, subject to the filings’ scope and accuracy. They do not reveal:
- every purchase and sale between the two dates
- the exact dates or prices of the net increase
- whether trading occurred during the chart range
- whether another affiliated or hedged position changed the economic exposure
- whether the manager caused the later breakout
Form 13F is therefore context, not real-time proof of a chart narrative. Readers should use the current SEC instructions and filings rather than rely on a generalized summary for compliance conclusions.
Accumulation vs. Similar Terms
| Term | What it describes | Main distinction |
|---|---|---|
| Accumulation | Inference that buying is absorbing supply | Adds a claim about pressure or positioning |
| Consolidation | Price moving within a range or compressed structure | Describes price without assigning intent |
| Distribution | Inference that selling is meeting demand | Opposite positioning narrative, with the same evidence limits |
| Pullback | Countertrend move within a prior trend | Does not require a prolonged base |
| Reversal | Sustained change in price direction | Describes changed structure rather than hidden intent |
How to Evaluate an Accumulation Claim
- Separate every observation from every inference.
- Define the range, timeframe, price field, and adjustment method.
- State the volume field and comparison baseline.
- Identify whether data cover one venue or consolidated activity.
- Define the breakout and failure rules before the outcome.
- Verify any participant claim with a relevant source and reporting date.
- Explain what the source omits, including delays and scope limits.
- Avoid converting one favorable outcome into proof of the narrative.
Execution and Risk
Even if an accumulation thesis is reasonable, it does not specify a trade. An upside break can gap beyond the range, reverse, or occur in thin liquidity. A market order may execute away from the displayed price; a limit order may not fill.
An investor also needs to distinguish:
- thesis evidence from entry timing
- desired exposure from position size
- chart invalidation from maximum acceptable loss
- price trend from issuer valuation and financial condition
Risks and Common Mistakes
- Calling every base after a decline accumulation.
- Treating higher volume as proof of institutional buying.
- Inferring buyer identity from anonymous or aggregated data.
- Using later Form 13F holdings to narrate exact earlier trades.
- Ignoring managers, securities, or positions outside a filing’s scope.
- Labeling the range only after a successful upside break.
- Assuming support or the breakout must hold.
- Ignoring spread, gaps, market depth, leverage, and event risk.
Public Source Checks
- SEC: Frequently Asked Questions About Form 13F explains the filing framework and quarter-end holdings information. The SEC notes that the FAQs reflect staff views rather than a Commission rule or statement.
- CFTC Futures Glossary defines charting and technical-analysis terminology using price, volume, and open-interest data.
- CFTC: Commodity Trading Systems Sold on the Internet warns about selected hypothetical results, omitted costs, spreads, and execution assumptions.
- Investor.gov: Executing an Order explains why the displayed market price can differ from an actual execution.
Related Terms
- Trading Volume: Completed market activity that does not identify intent by itself.
- Volume Analysis: Methods for comparing trading activity with price.
- Support and Resistance: Reaction zones that may define the observed range.
- Breakout: A pre-defined boundary crossing that does not establish participant identity.
- Reversal: A sustained change in price structure.
FAQs
Does high volume prove accumulation?
Does an upside breakout confirm institutional buying?
Is accumulation always followed by a price increase?
This article provides general market-analysis education, not a prediction, compliance interpretation, or personalized investment recommendation.