Yield Curve Arbitrage
Fixed-income relative-value strategy that seeks to profit from mispricing between different maturity points on the same yield curve.
Yield curve arbitrage is a fixed-income relative-value strategy that tries to profit when one maturity point on a bond or swap curve looks rich or cheap relative to nearby maturity points. The trade is usually about curve shape, not simply whether all interest rates rise or fall.
The word arbitrage can be misleading. In practice, most yield curve arbitrage trades are not risk-free arbitrage. They are relative-value trades that depend on hedging, funding, liquidity, model assumptions, and the time it takes for a curve relationship to normalize.
Core Idea
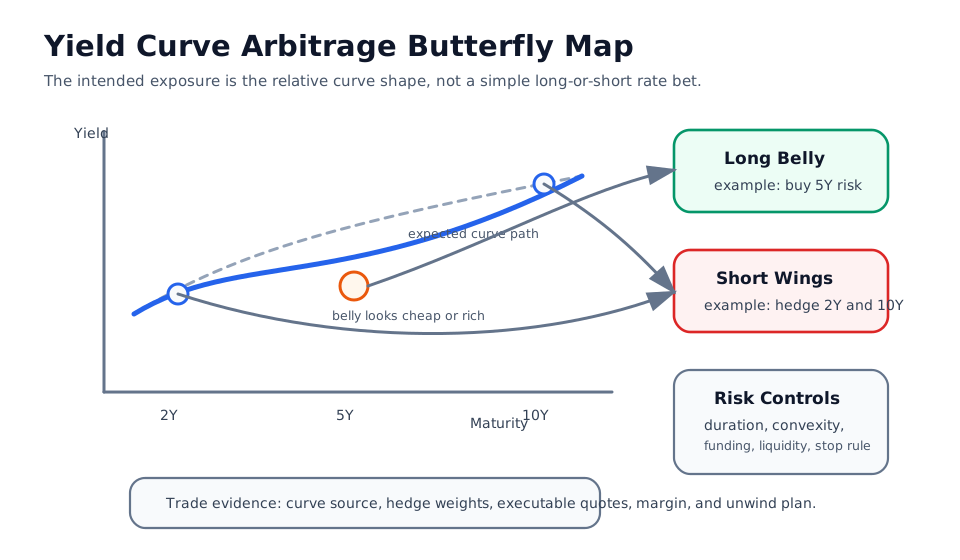
A curve arbitrage trader compares yields across maturities and looks for a relationship that appears inconsistent with the rest of the curve. The trader may then build a position that is long one maturity zone and short another so the main exposure is the relative move, not the entire level of rates.
The diagram shows a common butterfly-style setup: the middle maturity, or belly, looks cheap or rich versus the shorter and longer wings.
Common Structures
| Structure | What the trader is expressing | Typical use |
|---|---|---|
| Butterfly | One maturity is rich or cheap relative to shorter and longer neighbors | Local distortion at the belly or wings |
| Barbell | Short and long maturities are preferred over the middle, or the reverse | Curve-shape and carry tradeoff |
| Bullet | One maturity point carries the main exposure | Concentrated view on one part of the curve |
| Steepener or flattener | The spread between short and long yields should widen or narrow | Macro or policy-rate positioning |
The cleaner the hedge, the more the trade depends on relative movement. The weaker the hedge, the more the trade can become an outright duration bet.
Yield Curve Arbitrage vs. Roll-Down Return
| Concept | Main question | Practical distinction |
|---|---|---|
| Yield curve arbitrage | Is one maturity mispriced relative to another? | Relative-value trade across points on the curve |
| Roll-down return | What return may come from moving down an existing curve over time? | Carry and maturity-aging effect |
| Steepener or flattener | Will the spread between maturities widen or narrow? | Directional view on curve slope |
These concepts can appear together, but they are not the same. A curve arbitrage trade can have roll-down, carry, and slope exposure even when the intended thesis is local relative value.
Risk Controls
Key risks include:
- hedge ratios that fail when the curve twists instead of shifting in parallel
- duration exposure that remains after an incomplete hedge
- convexity differences between maturity points
- funding, repo, or margin changes during the holding period
- liquidity gaps between the instrument being bought and the instrument being shorted
- model risk from stale curves, interpolation assumptions, or wrong benchmark selection
- crowding risk when many relative-value traders hold similar positions
Related Terms
- Yield Spread: Difference between yields that may be part of a curve trade.
- Duration: Rate-sensitivity measure traders often hedge to isolate curve shape.
- Convexity: Important when curve moves are large or uneven.
- Roll-Down Return: Return component from a bond aging along the curve.
- Arbitrage: Broader price-consistency and relative-value concept.