Ascending Channel
An ascending channel places price between rising parallel boundaries. Learn how it is drawn, how breaks are defined, and why the pattern can fail.
An ascending channel is a price structure bounded by two upward-sloping, approximately parallel lines. The lower line connects rising reaction lows, while the upper line is placed through rising reaction highs. It describes where an uptrend has traded; it does not prove that the trend will continue.
The construction matters. An analyst should identify the anchor points, chart scale, timeframe, price field, and break rule before using the channel as evidence.
Key Takeaways
- A valid candidate needs higher reaction lows and highs, not merely an upward-looking price path.
- The lower trend line usually anchors the structure; a parallel copy placed through a relevant high creates the upper boundary.
- A touch, intraday cross, and close outside the channel are different events.
- An upside break can indicate acceleration, while a lower break can indicate trend deterioration. Neither predicts what comes next.
- Channel width is a geometric distance, not fair value or a guaranteed price objective.
- Spread, market depth, gaps, and order type determine whether a chart observation can be executed near the displayed price.
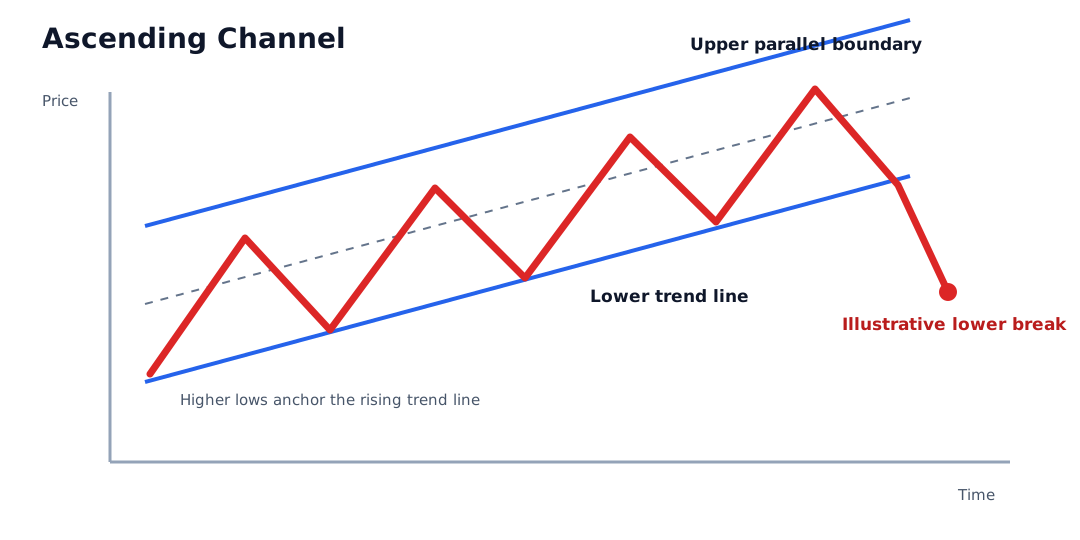
How an Ascending Channel Is Constructed
Start with at least two identifiable reaction lows. A reaction low is a local trough between advances, not simply any low-priced bar. Connecting those lows creates the tentative lower trend line. A third reaction near that line provides an out-of-sample check on whether the boundary remains useful.
The upper boundary is normally a parallel copy positioned through a meaningful reaction high. This is different from independently fitting one line to the lows and another to the highs: independently fitted lines can converge or diverge and may describe a wedge rather than a channel.
Record these choices:
| Choice | What must be specified | Why it matters |
|---|---|---|
| Timeframe | Intraday, daily, weekly, or another interval | Different intervals can show conflicting structures |
| Price field | Highs and lows, closes, or another consistent field | Switching fields after a break changes the test |
| Anchors | Exact bars used for the lower line and upper placement | Small changes can alter the boundary value |
| Scale | Arithmetic or logarithmic | Long price series can look materially different |
| Tolerance | Exact line or pre-defined zone around it | Markets rarely turn at one exact decimal |
| Break rule | Intraday cross, close, distance filter, or multi-bar rule | Determines when the event is counted |
Worked Example
Assume a daily chart has reaction lows of $50 on day 5 and $56 on day 15. On an arithmetic chart, the lower-line slope is:
Slope = ($56 - $50) / (15 - 5) = $0.60 per trading day
The estimated lower boundary on day 25 is:
$50 + (25 - 5) x $0.60 = $62
Suppose the upper parallel boundary is consistently $12 above the lower line. Its day-25 value is therefore $74.
If price trades at $61.70 intraday but closes at $62.40, the result depends on the rule:
| Pre-declared rule | Day-25 result |
|---|---|
| Any trade below $62 | Lower-boundary break |
| Close below $62 | No break |
| Close at least 1% below $62 | No break; threshold is $61.38 |
This example shows why saying that price “broke the channel” is incomplete unless the boundary value and break rule are stated.
What Price Location Can and Cannot Show
Near the Lower Boundary
Price near the lower line shows that the market is testing the prior rate of ascent. It does not create support by itself. A bounce, a close below the line, or prolonged movement along the boundary can each produce a different interpretation.
Near the Upper Boundary
Price near the upper line shows that it has reached the high side of the previously observed path. The line is not a mandatory selling point. Strong demand can carry price above it, while a reversal can begin before price reaches it.
Outside the Channel
An upper break may indicate faster price appreciation; a lower break may indicate that the prior slope is no longer being maintained. Either event can be temporary. A price path can leave the channel, retest it, form a new channel, or become range-bound.
Ascending Channel vs. Similar Structures
| Structure | Boundaries | Primary distinction |
|---|---|---|
| Ascending channel | Two rising, roughly parallel lines | Both boundaries rise at approximately the same rate |
| Ascending Triangle | Horizontal resistance and rising support | Range narrows toward a flat upper zone |
| Rising wedge | Two rising lines that converge | Lower boundary usually rises faster than the upper boundary |
| Cup and Handle | Rounded base followed by a smaller consolidation | Organized around a prior high, not parallel boundaries |
| Trend line | One line through reaction points | Does not define the opposite side of a channel |
How to Evaluate a Channel Claim
- Confirm that a meaningful advance and multiple reaction points existed.
- Record the anchor bars and calculate the boundary value for the observation date.
- Verify that the two boundaries are approximately parallel under the chosen scale.
- State whether boundaries are exact lines or tolerance zones.
- Define the break with the same price field used in the test.
- Compare volume with a stated baseline rather than calling it merely “high” or “low.”
- Separate the chart event from the order: signal time, submission time, order type, fill, and costs are different records.
- Test failed and incomplete channels, not only visually clean survivors.
Breaks, Orders, and Execution
A channel break is a market-data observation. It is not an order. A stop order, stop-limit order, market order, and limit order can respond differently when price moves quickly through a boundary.
For example, a sell stop can become a market order after its trigger and execute below the displayed channel line. A stop-limit order can control the acceptable price but remain unfilled. These tradeoffs are especially important around gaps or thin order books.
Risks and Common Mistakes
- Drawing the channel after the subsequent move is already known.
- Forcing parallel lines onto a wedge or irregular trend.
- Using an arithmetic chart for one test and a logarithmic chart for another without disclosure.
- Treating every touch as an entry or every break as a reversal.
- Assuming a channel-width projection is a valuation estimate.
- Ignoring dividends, splits, contract rolls, or bad data that alter the plotted series.
- Treating volume as directional proof rather than activity.
- Ignoring short-sale, leverage, gap, and liquidity risks after a lower break.
Public Source Checks
- CFTC Futures Glossary describes charting as plotting price trends, average movements, trading volume, and open interest for technical analysis.
- Investor.gov: Types of Orders explains differences among market, limit, and stop orders.
- Investor.gov: Executing an Order explains why an investor’s displayed price and actual execution can differ.
- FINRA: Stop Orders in Volatile Markets discusses trigger and execution-price risk for stop orders.
Related Terms
- Trend Line: The lower anchor used to establish the channel’s slope.
- Support and Resistance: The broader framework for interpreting channel boundaries.
- Breakout: Movement through a boundary under a specified rule.
- Ascending Triangle: A converging structure with flat resistance rather than a rising parallel upper line.
- Trading Volume: Activity that can be compared with a defined baseline around a boundary test.
FAQs
How many touches define an ascending channel?
Is an ascending channel bullish?
Does a close below the channel confirm a reversal?
Can an ascending channel be drawn on a logarithmic chart?
This article provides general chart-reading education, not a market forecast, trading instruction, or personalized investment recommendation.