Double Top Pattern
A double top is a two-peak reversal structure evaluated around a neckline break. Learn its anatomy, measured move, confirmation rules, and risks.
A double top is a potential bearish reversal pattern with two reaction peaks near a similar price, separated by a meaningful decline. Many definitions do not treat the pattern as complete until price breaks below the intervening reaction low, called the neckline.
Two similar highs are not enough by themselves. The prior advance, peak tolerance, pullback depth, time between peaks, neckline, completion rule, and failure condition all affect whether the label is defensible.
Key Takeaways
- A double top normally forms after an advance and contains two distinct peaks separated by a reaction low.
- “Similar peaks” requires a numerical price tolerance; perfect equality is unnecessary.
- The reaction low defines the neckline, but an analyst must choose whether it is a line or zone.
- A neckline break completes the pattern under many definitions but does not guarantee further decline.
- The peak-to-neckline distance can produce an illustrative measured move, not fair value or a promised target.
- Acting on the pattern can introduce gap, liquidity, order, leverage, and short-sale risks.
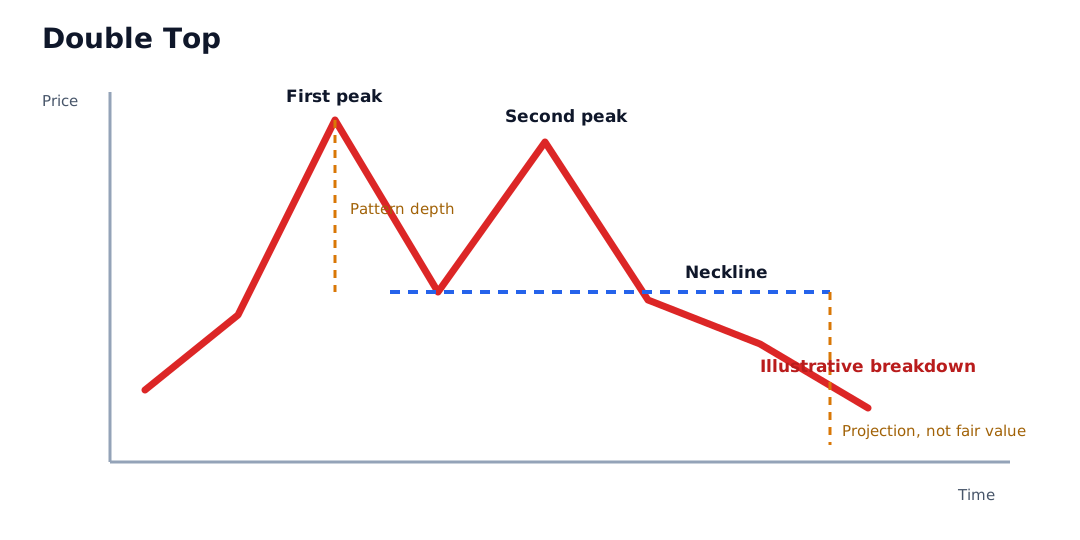
Pattern Anatomy
| Part | Role | Evidence to record |
|---|---|---|
| Prior advance | Establishes the trend that may be reversing | Return and lookback window |
| First peak | Marks the initial reaction high | Price field, date, and surrounding bars |
| Pullback | Separates the peaks and creates the neckline | Depth, duration, and reaction low |
| Second peak | Retests the first peak’s area | Difference from first peak and time elapsed |
| Neckline | Boundary at the intervening low or low zone | Exact value, tolerance, and scale |
| Break | Completes the structure under the selected rule | Intraday, close, buffer, or multi-bar rule |
| Failure | Invalidates or weakens the setup | Return above neckline, peak break, or time limit |
A double top is a multi-bar structure, not a two-candle pattern. The peaks can contain many bars, and the second peak can be somewhat above or below the first within a pre-defined tolerance.
Worked Example
Assume a daily chart shows:
- first peak: $82.00
- intervening reaction low and neckline: $72.00
- second peak: $81.50
- completion rule: daily close at least 1% below the neckline
- observed close after the second peak: $70.80
The two peaks differ by:
Absolute peak difference / first peak = |$82.00 - $81.50| / $82.00 x 100 = 0.61%
If the research rule permits a 2% peak difference, the pair satisfies that tolerance. The filtered neckline threshold is:
$72.00 x (1 - 0.01) = $71.28
The $70.80 close satisfies the selected completion rule. It does not ensure a profitable decline; price could reclaim the neckline on the next session.
The pattern depth from the first peak to the neckline is $10.00. Subtracting it from the $71.28 filtered break gives an illustrative projection of $61.28:
$71.28 - ($82.00 - $72.00) = $61.28
This number is chart geometry, not a valuation estimate, expected return, or guaranteed execution level. Using the second peak, another neckline point, or a zone edge would change it.
Candidate vs. Completed Double Top
The distinction prevents premature labeling:
| State | Required evidence | Remaining uncertainty |
|---|---|---|
| Possible resistance retest | Price approaches a prior high | No second reversal or neckline break |
| Candidate double top | Distinct second peak and pullback begin | Neckline may still hold |
| Completed under a rule | Price meets the pre-declared neckline-break condition | Follow-through can fail |
| Failed or invalidated | Price violates the stated failure rule | A new structure may form |
Analysts who count only completed winners create hindsight bias. A fair historical test includes candidates that exceeded the first peak, never broke the neckline, or broke and quickly recovered.
How to Define Similar Peaks
No universal percentage determines whether two peaks are similar. Possible rules include:
- absolute price difference
- percentage difference from the first peak
- difference measured in average true range or another volatility unit
- a shared resistance zone based on highs or closes
The tolerance should reflect tick size, instrument volatility, and timeframe. It should be fixed before inspecting the outcome. A very wide tolerance can classify ordinary swings as double tops; a zero tolerance can reject economically similar peaks.
How to Define the Neckline Break
Possible definitions include:
- any intraday trade below the reaction low
- a close below the neckline
- a close below a fixed percentage or volatility buffer
- two consecutive closes below the line
- a break followed by a failed retest from below
Stricter confirmation can reduce some whipsaws but enters later and may worsen the available price. There is no rule that removes false breakdowns.
Double Top vs. Similar Structures
| Structure | Shape | Main distinction |
|---|---|---|
| Double top | Two similar peaks with one intervening neckline | Usually evaluated as a possible reversal after an advance |
| Triple top | Three tests of a similar resistance area | Requires a third distinct peak |
| Head and Shoulders | Three peaks, with the middle peak highest | Uses two reaction lows to construct a neckline |
| Cup and Handle | Rounded recovery and smaller handle | Usually framed as a possible continuation above prior resistance |
| Trading range | Repeated highs and lows within zones | May have many tests without a reversal interpretation |
Volume and Market Context
Some analysts look for lower volume at the second peak or higher volume on the neckline break. Those observations require a stated baseline and do not prove seller intent. Volume can reflect opening or closing auctions, news, expiry, index changes, short covering, or forced activity.
Broader market strength can also conflict with a bearish pattern in one security. That conflict does not automatically invalidate the chart, but it should be documented rather than ignored.
Orders and Short-Sale Risk
A downside break is not an executable price. A sell stop may trigger and fill below the neckline during a gap. A stop-limit order can avoid an unacceptable price but may not execute.
Short selling adds risks not shown by the pattern:
- losses can grow as price rises
- borrow can become expensive or unavailable
- the position can be bought in under account or lender rules
- distributions and corporate actions can create obligations
- a squeeze or gap can move price beyond a planned exit
An investor reducing an existing long position and a trader opening a short position are making different decisions even if both observe the same neckline break.
How to Evaluate a Double Top Claim
- Confirm the prior advance with a stated lookback.
- Record the exact peak bars and permitted peak difference.
- Require a meaningful pullback rather than adjacent noisy highs.
- Define the neckline using a consistent price field.
- State the completion and failure rules.
- Compare volume with a named baseline if volume is used.
- Separate signal time, order submission, fill, and transaction cost.
- Include failed and incomplete candidates in any backtest.
Risks and Common Mistakes
- Calling two nearby highs a complete pattern before a neckline break.
- Moving the neckline after the breakdown to improve the historical result.
- Requiring perfect peak equality or accepting an unlimited difference.
- Ignoring the prior trend and pullback depth.
- Presenting the measured move as fair value or a profit promise.
- Treating volume as directional proof.
- Assuming a stop order guarantees the trigger price.
- Ignoring spread, gaps, borrow, leverage, and short-squeeze exposure.
Public Source Checks
- CFTC Futures Glossary describes charting as plotting trends in price, average movements, volume, and open interest for technical analysis.
- Investor.gov: Types of Orders explains market, limit, and stop-order mechanics.
- Investor.gov: Executing an Order explains why an execution can differ from a displayed quote.
- FINRA: Stop Orders in Volatile Markets discusses stop-trigger and execution-price risk.
Related Terms
- Neckline in Technical Analysis: The reaction boundary used to evaluate pattern completion.
- Head and Shoulders: A three-peak reversal structure with related completion questions.
- Breakout: Movement through a pre-defined support, resistance, or pattern boundary.
- Support and Resistance: The framework for interpreting the peak area and neckline.
- Trading Volume: Activity that should be compared with a stated baseline.
FAQs
When is a double top complete?
Must both peaks have the same price?
Does a neckline break guarantee a decline?
Is the measured move a reliable price target?
This article provides general chart-reading education, not a market forecast, short-sale instruction, or personalized investment recommendation.