Fractal Indicator
Fractal Indicator explained: the five-bar pivot rule, confirmation delay, practical uses, and limitations of fractal-high and fractal-low signals.
The Fractal Indicator is a technical pattern that marks a local high or low when the middle bar of a five-bar sequence has a more extreme high or low than the two bars on each side. It is commonly associated with the Bill Williams fractal, but it is a short pivot rule rather than proof that financial prices have a mathematical fractal structure.
Key Takeaways
- An upper fractal uses bar highs; a lower fractal uses bar lows.
- Two later bars are required, so the center pivot is confirmed only after a delay.
- The marker identifies a past local extreme, not a guaranteed reversal.
- Traders may use a confirmed fractal as a breakout level, trailing reference, or structural pivot.
- Platform arrow direction and the labels bullish or bearish can vary; verify the actual price rule.
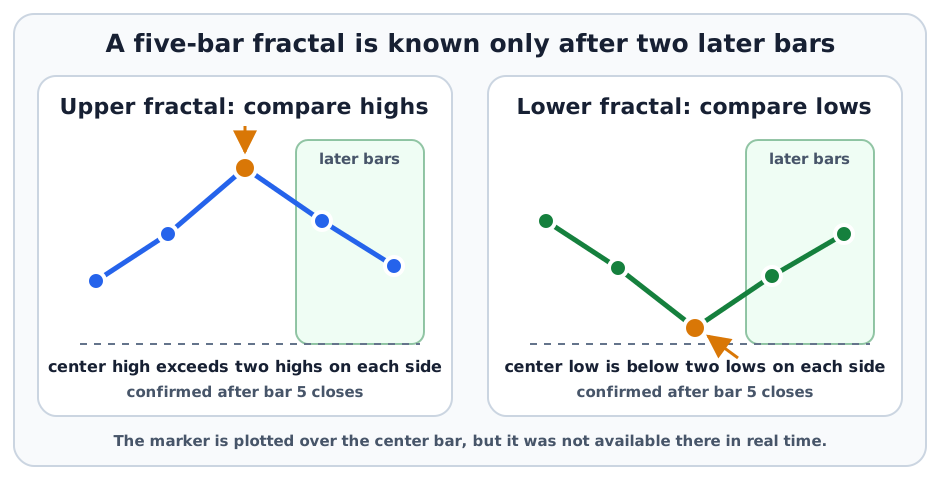
Five-Bar Fractal Rule
Let bar t be the center bar. A strict upper fractal exists when:
A strict lower fractal exists when:
Some charting platforms allow equal highs or lows, use longer formations, or position arrows differently. The platform definition should therefore be checked before signals are compared.
Why Confirmation Is Delayed
At the end of the center bar, no one knows whether its high or low will remain the most extreme point in the five-bar sequence. Bars t+1 and t+2 must finish before the pattern is confirmed.
That delay prevents the standard five-bar marker from being a real-time turning-point prediction. A backtest that enters at the center bar’s close uses information that was not yet available and introduces look-ahead bias.
Example
Suppose five consecutive daily highs are $48, $50, $54, $52, and $51. The middle high of $54 exceeds the two highs before and after it, so it becomes a confirmed upper fractal only after the fifth day is complete.
A trader might place a conditional breakout rule above $54. That is different from selling merely because an upper fractal appeared. If price later trades above $54, the trader still needs an order type, acceptable entry range, invalidation point, position size, and maximum loss.
Common Uses
| Use | Rule concept | Main risk |
|---|---|---|
| Breakout reference | Act only if price exceeds a confirmed upper or lower pivot | False breakout and slippage |
| Stop reference | Place or trail a stop beyond a structural fractal | Normal volatility can trigger the stop |
| Trend structure | Track sequences of higher or lower fractals | Confirmation arrives late |
| Range mapping | Use recent fractals as candidate boundaries | Repeated pivots can clutter a chart |
Fractals are often more useful as objective reference points than as standalone reversal signals.
Fractal Indicator Versus Divergence
The fractal rule compares one bar with nearby bars. Divergence compares the direction of price swings with the direction of a separate indicator.
An upper fractal can form without momentum divergence, and divergence can exist before any five-bar fractal is confirmed. They answer different questions.
How to Evaluate a Fractal Rule
- Confirm whether the platform uses strict or non-strict comparisons for equal highs and lows.
- Record when the marker became knowable, not where it is drawn retrospectively.
- Define whether the fractal is a reversal observation, breakout trigger, or stop reference.
- Test how gaps, spreads, fees, and missed fills affect the rule.
- Measure results on data not used to select the timeframe or filters.
Risks and Limitations
- Look-ahead bias: The pattern is drawn over the center bar but needs two later bars.
- Frequency: Short timeframes and range-bound markets can produce many low-value pivots.
- Naming inconsistency: An upper fractal may be called bearish because it marks a high, or bullish when used as an upside breakout level.
- Data sensitivity: Different session boundaries or price feeds can change bar highs and lows.
- No value estimate: The pattern says nothing about earnings, cash flow, credit quality, or intrinsic value.
- Execution risk: A stop or breakout order can fill beyond the fractal level during a gap.
The CFTC Futures Glossary describes technical analysis as analysis of market-generated data. Investor.gov explains how market, limit, and stop orders behave once a chart observation becomes an actual order. Neither source endorses fractal trading.
FAQs
Is a fractal known on the middle bar?
Does an upper fractal mean price will fall?
Why do fractal arrows differ across platforms?
Related Terms
- Volume Analysis: Evaluation of trading activity across periods or price moves.
- Kijun-sen: The midpoint of the highest high and lowest low over a selected window.
- Momentum: The direction and rate of price change.
- Divergence: Disagreement between price and an indicator.
This article is educational and does not provide personalized investment or trading advice. Fractal signals cannot guarantee gains or prevent losses.