OHLC Chart: Open, High, Low, and Close Explained
An OHLC chart uses one price bar per period to display the open, high, low, and close of a traded instrument.
An OHLC chart is a price chart that displays the open, high, low, and close for each selected period. One OHLC bar can represent a minute, hour, day, week, month, or another interval.
The bar shows both direction and range. A line chart commonly plots only one field, such as the close, while an OHLC bar also shows where the period began and the highest and lowest reported prices reached in between.
Key Takeaways
- OHLC stands for open, high, low, and close.
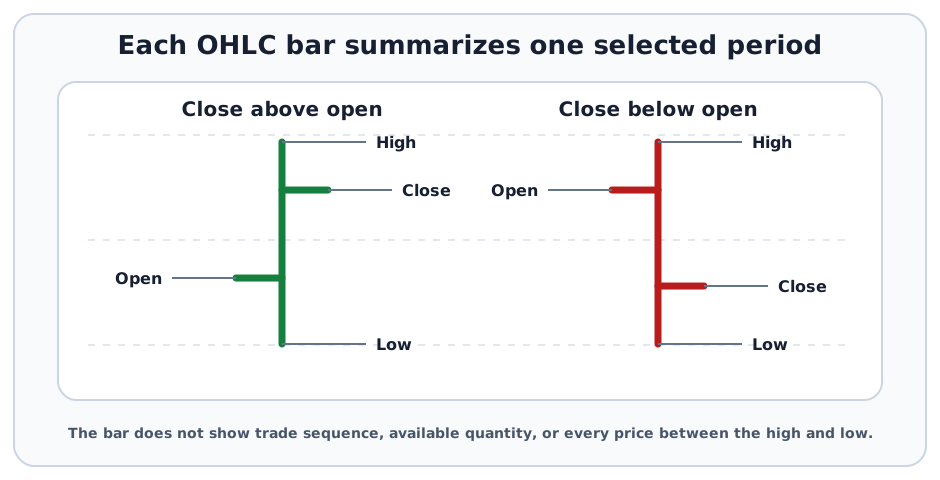
- The vertical line spans the reported high-low range for the period.
- By common convention, the left tick marks the open and the right tick marks the close.
- A close above the open creates an upward bar; a close below the open creates a downward bar.
- An OHLC bar does not show how much quantity was available at each price or the sequence of every trade.
- Session definitions, adjusted prices, data corrections, and aggregation rules can change the chart.
Anatomy of an OHLC Bar
See Stock Quote Price Fields for the underlying open, high, and low definitions.
| Component | What it records | What to verify |
|---|---|---|
| Opening price | First official or qualifying price for the period | Auction, first trade, session, and vendor convention |
| High | Highest qualifying trade price during the period | Venue, trade condition, correction, and available size |
| Low | Lowest qualifying trade price during the period | Venue, trade condition, correction, and available size |
| Close | Final official or qualifying price for the period | Regular session, closing auction, last trade, or vendor method |
On a conventional OHLC bar:
- the vertical line runs from low to high;
- the short tick extending left is the open; and
- the short tick extending right is the close.
Some charting software colors or thickens bars based on whether the close is above or below the open. The user should verify the chart legend rather than assuming every platform uses the same styling.
What OHLC Bars Reveal
Direction within the period
The relative position of open and close shows whether the period finished above or below where it began. This is not the same as the change from the previous period’s close.
Total reported range
High minus low measures the observed price span. A wide bar may reflect volatility, a news event, thin liquidity, or a long aggregation interval. The bar alone does not identify the cause.
Closing location
The close can be compared with the high-low range. A close near the high means the period ended toward the upper part of its range, but it does not guarantee follow-through during the next period.
Gaps between bars
If the new period opens away from the previous period’s range, the chart may show a Price Gap. The chart’s session settings determine whether pre-market or overnight trades are visible.
OHLC Chart vs. Candlestick and Line Charts
| Chart type | Data displayed | Main advantage | Main limitation |
|---|---|---|---|
| OHLC bar | Open, high, low, and close | Compact display of direction and range | Less visually immediate for some readers |
| Candlestick | Usually the same four fields | Body and wick emphasize open-close relationship | Color and pattern names can be overinterpreted |
| Line chart | Usually one field per period, often close | Simple view of longer price direction | Hides intraperiod range |
| Point-and-figure chart | Price changes meeting a selected threshold | Filters out some time-based noise | Omits conventional time intervals and OHLC structure |
OHLC and candlestick charts usually encode the same four fields. The difference is visual grammar, not a different underlying market record.
Timeframe and Aggregation
An OHLC bar is only meaningful with its interval and session:
- A one-minute bar uses qualifying data within that minute.
- A daily bar may use regular-session data even when the instrument also trades after hours.
- A weekly bar typically uses the first open, highest high, lowest low, and final close from its component periods.
- A continuous futures chart may combine contract months using a vendor-specific roll and adjustment method.
Aggregating data can hide sequence and liquidity. A daily bar that spans 95 to 110 does not reveal whether those prices occurred seconds apart or at opposite ends of the session.
Closing Price vs. Settlement Price
For stocks, closing price commonly refers to the final regular-session trade or an official auction-derived field. For futures, a settlement price may be calculated under exchange procedures and used for daily account valuation and margin processes.
The closing trade, closing range, and settlement price can differ. An analyst should not substitute one field for another without checking the instrument and data definition.
Data Quality Checklist
Before relying on an OHLC chart, verify:
- Instrument: Ticker, share class, contract month, venue, and currency.
- Interval: Minute, daily, weekly, monthly, or another aggregation period.
- Session: Regular-hours, extended-hours, overnight, or combined data.
- Price basis: Adjusted or unadjusted history and treatment of corporate actions.
- Field definitions: Official open and close, first and last trade, or vendor-derived values.
- Trade eligibility: Auctions, odd lots, late reports, canceled trades, and condition codes.
- Data timing: Real-time, delayed, end-of-day, or corrected.
- Liquidity: Volume, spread, and depth near the high and low.
Common Mistakes
- Reading an OHLC bar without checking its timeframe.
- Assuming the bar shows the order in which high and low occurred.
- Treating the high or low as a price available for meaningful quantity.
- Confusing close-to-open direction with return from the prior close.
- Comparing regular-session bars with extended-hours bars.
- Ignoring splits, distributions, ticker changes, and futures rolls.
- Treating a bar shape or pattern as a complete trading strategy.
Public Source Checks
Investor.gov explains that historical stock quotes commonly provide daily opening, closing, high, low, and volume data. Its closing-price definition distinguishes the regular-session close and high-low fields from after-hours trades. The CFTC’s guide to reading futures price tables explains open, high, low, close, and settlement terminology for futures.
Related Terms
- Stock Quote Price Fields: Opening, high, low, last-sale, unchanged, and trailing-range fields.
- Candlestick: Alternative display using the same four price fields.
- Trading Volume: Quantity traded during a period.
FAQs
What does OHLC stand for?
Is an OHLC chart the same as a candlestick chart?
Does an OHLC bar show whether the high or low occurred first?
Is the futures close always the settlement price?
Educational Use
This article is for financial education only. It does not provide personalized investment or trading advice and does not recommend a chart pattern, timeframe, instrument, or strategy.