Implied Volatility
Implied volatility is the volatility level embedded in option prices and reflects the move size the market is pricing.
Implied volatility, often shortened to IV, is the volatility level implied by an option’s market price. It is the volatility input that makes an option-pricing model line up with the price buyers and sellers are actually quoting.
IV does not predict direction. High IV usually means the options market is pricing a larger possible move. It does not say whether that move will be up or down.
The diagram shows the practical flow: the market quotes an option price, the pricing model solves backward for volatility, and that IV becomes a risk input for expected move, vega exposure, and event-risk decisions.
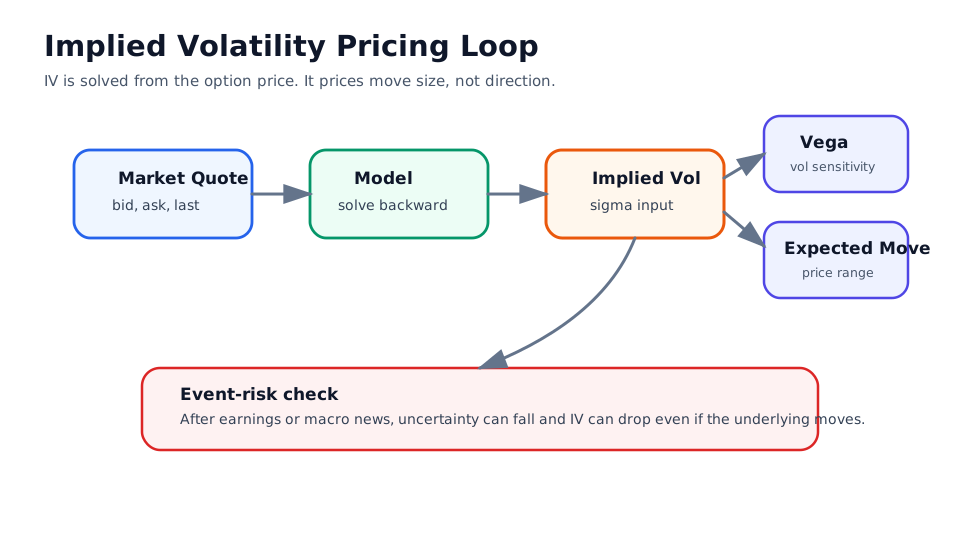
How Implied Volatility Works
An option-pricing model treats option value as a function of several inputs:
where S is the underlying price, K is the strike price, T is time to expiration, r is the risk-free rate, q is dividend or carry treatment, and sigma is volatility.
The market gives the option price. The model then solves backward for the volatility input that explains that price. That solved input is implied volatility.
Why IV Matters
Implied volatility is one of the main drivers of option premium:
- Higher IV usually makes calls and puts more expensive, all else equal.
- Lower IV usually makes calls and puts cheaper, all else equal.
- IV can change quickly around earnings, economic data, central-bank decisions, lawsuits, takeover rumors, and other event risk.
- A trader can be directionally right and still lose money if the realized move is smaller than the move already priced into the option.
This is why IV is a pricing input, a risk factor, and a market-sentiment signal at the same time.
Implied Versus Realized Volatility
| Measure | What it uses | What it answers |
|---|---|---|
| Historical or realized volatility | Past returns | How much the asset actually moved over a lookback period |
| Implied volatility | Current option prices | How much movement the options market is pricing before expiration |
| Expected move | Option prices or IV converted into a price range | How large a move may be priced over a specific period |
Historical volatility is backward-looking. Implied volatility is market-priced and forward-looking, but it is not a guarantee.
Event Example
Suppose a stock trades at $100 before earnings and one-week at-the-money options imply a large expected move. A trader buys a call because they expect a rally.
After earnings, the stock rises to $102, but IV collapses because the event uncertainty is gone. The call can lose value if the market had priced a larger move than the stock actually delivered. This is often called an IV crush.
How Traders Use IV
Common uses include:
- comparing option richness across expirations or strikes
- deciding whether to buy or sell volatility exposure
- sizing event trades around earnings or macro releases
- measuring vega exposure in a portfolio
- comparing IV with realized volatility, IV rank, or IV percentile
- building volatility strategies such as straddles, strangles, calendars, and iron condors
IV should be tied to an actual contract, timestamp, bid-ask spread, and strategy. A stale IV number from an illiquid option can be misleading.
Authority Sources
Use public sources to anchor the option mechanics:
- OCC Characteristics and Risks of Standardized Options is the core disclosure source for standardized option risks and mechanics.
- FINRA’s options overview explains option pricing inputs, including the role of implied volatility and vega.
- Cboe VIX products describe VIX as a measure of market expectations for near-term volatility conveyed by S&P 500 option prices.
For a specific trade, verify the option chain, timestamp, model convention, underlying price, expiration, strike, bid-ask spread, interest/dividend assumptions, and whether the quoted IV comes from a reliable data source.
Quiz
Related Terms
- Volatility: The broader concept that IV converts into option pricing.
- Option Value: The value affected by intrinsic value, time, volatility, rates, and dividends.
- Vega: Measures option sensitivity to changes in implied volatility.
- Straddle: A common structure for trading expected movement rather than direction.
- Put-Call Ratio: A sentiment indicator that can be reviewed alongside volatility.
- Call Option: One of the contracts whose premium embeds IV.
Review Checklist
- Confirm the exact option series and timestamp used for the IV quote.
- Compare IV with realized volatility and with nearby strikes and expirations.
- Check whether earnings, dividends, macro events, or corporate actions explain elevated IV.
- Estimate how much IV can fall after the event.
- Tie IV exposure to position vega, liquidity, bid-ask spread, and exit rules.