Cup and Handle Pattern
A cup and handle is a rounded recovery followed by a smaller consolidation near resistance. Learn its breakout rules, measured move, and failure risks.
A cup and handle pattern is a potential bullish continuation structure in which price declines and recovers in a rounded “cup,” then forms a smaller pullback or consolidation called the handle near prior resistance. Many definitions require a break above the rim or handle boundary before treating the pattern as complete.
The label does not establish future return. The prior trend, cup shape, handle depth, resistance zone, break rule, and failure condition must be defined before the outcome is evaluated.
Key Takeaways
- The cup is a broad decline, stabilization, and recovery toward a prior high.
- The handle is a smaller consolidation near the right side of the cup; it is not simply any later decline.
- A candidate shape and a completed breakout are different states.
- No universal depth, duration, symmetry, or volume threshold defines every valid pattern.
- A cup-depth projection is illustrative geometry, not fair value or a guaranteed target.
- Gaps, spread, market depth, order type, and delayed recognition can make actual execution differ from the chart.
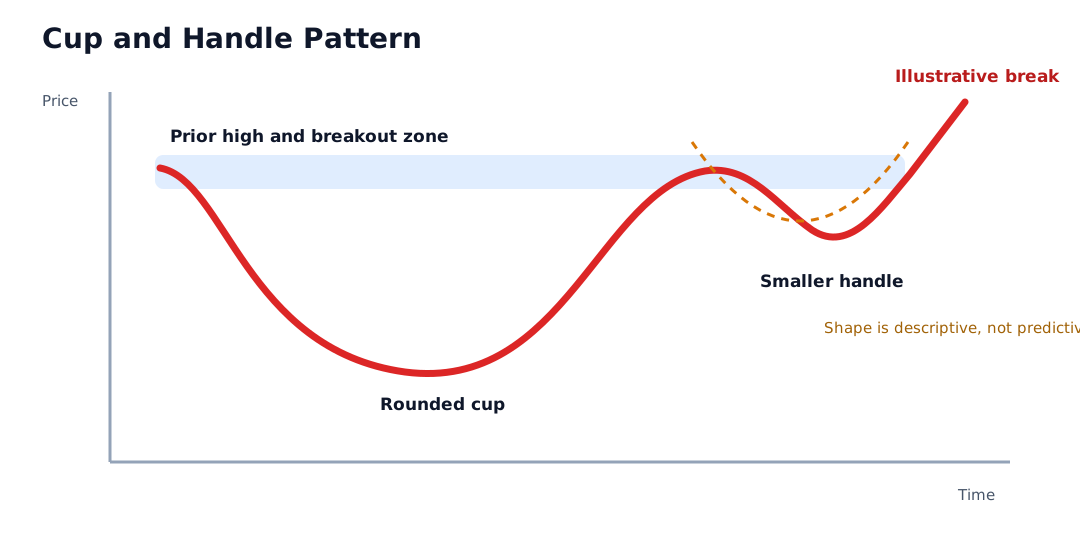
Pattern Anatomy
| Component | Common construction | What must be defined |
|---|---|---|
| Prior advance | Price rises before the consolidation | Lookback and minimum advance |
| Left rim | High before the cup decline | Price field and resistance tolerance |
| Cup low | Lowest area of the rounded consolidation | Depth, duration, and adjustment method |
| Right rim | Recovery toward the left-rim area | Permitted difference from the prior high |
| Handle | Smaller pullback or sideways range near resistance | Maximum depth, duration, and lower boundary |
| Breakout | Price crosses the selected rim or handle level | Intraday, close, buffer, or multi-bar rule |
| Failure | Price violates a pre-declared condition | Handle break, cup-level break, or time limit |
The visible shape may contain many smaller swings. A smooth curve is an illustration, not a requirement that market prices trace a perfect semicircle.
Worked Example
Assume a daily chart shows:
- left rim and resistance reference: $60.00
- cup low: $48.00
- right rim: $59.50
- handle low: $56.50
- completion rule: close at least 0.5% above $60.00
- observed breakout close: $60.50
The filtered breakout threshold is:
$60.00 x 1.005 = $60.30
The $60.50 close satisfies that rule. If the rule instead used an intraday trade above $60, an earlier high could have completed the pattern. The two definitions should not be mixed after seeing the result.
The cup depth is:
$60.00 - $48.00 = $12.00
Adding that depth to the $60.30 filtered threshold gives an illustrative projection of:
$60.30 + $12.00 = $72.30
The calculation does not estimate intrinsic value, probability, or expected return. A different rim, zone edge, scale, or adjustment method would change the result.
The handle decline from the $59.50 right rim to $56.50 is $3.00, or about 5.0% of the right-rim price. That measurement describes this example; it is not a universal validity threshold.
Candidate, Completion, and Outcome
| State | What is visible | What remains unknown |
|---|---|---|
| Rounded recovery | Price returns toward a prior high | A handle may not form |
| Candidate pattern | Smaller consolidation appears near resistance | Resistance may not break |
| Completed under a rule | Price satisfies the selected breakout condition | Follow-through and fill remain uncertain |
| Failed pattern | Price violates the stated failure rule | Another range or trend may develop |
Calling the structure successful because price later rose is circular unless the anchors, break, failure, and evaluation window were fixed in advance.
Rounded Cup vs. Sharp V-Reversal
A rounded cup suggests that the decline, stabilization, and recovery unfolded over a meaningful period. A V-shaped move falls and rebounds abruptly, often around a discrete event or volatility shock.
The distinction is subjective unless a method defines curvature, duration, and allowed slope changes. An analyst should not reject every sharp recovery or force every broad base into a cup. The practical question is whether the selection rule can be repeated on unseen data.
How to Define the Handle
The handle normally forms below or around the prior resistance area and is smaller than the cup. It can slope downward, move sideways, or contain a short range. Useful measurements include:
- decline from the right rim
- handle depth relative to cup depth
- number of bars
- upper and lower boundaries
- volume relative to a named baseline
- distance from the original rim
There is no universal handle percentage that applies across instruments, timeframes, and volatility regimes. A shallow numerical rule may reject volatile but coherent structures; a broad rule can classify ordinary selloffs as handles.
What Counts as the Breakout?
Possible completion rules include:
- any intraday trade above the handle high
- any intraday trade above the cup rim
- a close above a resistance zone
- a close beyond a fixed percentage or volatility buffer
- two consecutive closes above resistance
- a break followed by a retest that remains above the zone
The handle high and original rim can differ. A method must say which one controls. A stricter rule may reduce some false breaks but delay recognition or create a worse available price.
Volume and Participation
Some practitioners look for lower volume during the cup or handle and higher volume at the break. Those observations should be stated as measurements, not proof.
“Higher volume” requires a baseline, such as the median daily volume over the prior 20 sessions. Activity can be affected by news, auctions, expiry, index changes, short covering, or forced trades. Volume alone does not identify informed buying.
Cup and Handle vs. Similar Structures
| Structure | Core geometry | Primary distinction |
|---|---|---|
| Cup and handle | Rounded recovery plus smaller consolidation | Tests a prior high after a broad base |
| Saucer or rounding bottom | Rounded base without a required handle | May not have a separate near-rim consolidation |
| Double Top | Two similar peaks separated by a neckline | Evaluated as a possible reversal after an advance |
| Ascending Triangle | Rising reaction lows below flat resistance | Uses a straight rising lower boundary rather than a rounded cup |
| Trading range | Repeated reactions between zones | Does not require a rounded base or handle |
How to Evaluate a Cup and Handle Claim
- Identify the prior trend and adjusted price series.
- Record the left rim, cup low, right rim, and handle boundaries.
- State tolerances for rim similarity and handle size.
- Define the timeframe, price field, chart scale, and break rule.
- Specify the failure condition and evaluation horizon.
- Compare volume only with a named baseline.
- Separate signal time, order submission, fill, and transaction costs.
- Include patterns that failed, never completed, or could not be filled.
Risks and Common Mistakes
- Finding the cup only after a successful breakout.
- Treating every V-shaped recovery as a rounded cup.
- Calling a deep second selloff a handle without a stated threshold.
- Switching between the handle high and cup rim after the outcome.
- Presenting the cup-depth projection as fair value or a profit promise.
- Assuming volume proves buyer conviction.
- Assuming a stop or market order fills at the breakout line.
- Ignoring gaps, spread, liquidity, leverage, and broader market risk.
Public Source Checks
- CFTC Futures Glossary describes charting and technical analysis in terms of price, average movements, volume, and open interest.
- Investor.gov: Types of Orders explains market, limit, and stop-order mechanics.
- Investor.gov: Executing an Order explains why the displayed price and execution price may differ.
- FINRA: Stop Orders in Volatile Markets discusses trigger and execution-price risk.
Related Terms
- Breakout: Movement through the rim or handle boundary under a stated rule.
- Support and Resistance: The framework used to interpret the cup rim and handle.
- Double Top: A two-peak structure with a different completion boundary and reversal interpretation.
- Ascending Triangle: A narrowing structure with rising support below horizontal resistance.
- Trading Volume: Activity that requires a stated comparison baseline.
FAQs
Must the cup be perfectly round?
When is a cup and handle complete?
Does high breakout volume validate the pattern?
Is the cup-depth projection a price target?
This article provides general chart-reading education, not a market forecast, trading instruction, or personalized investment recommendation.