Opening Range in Technical Analysis
The opening range is the high-low band measured during a defined early-session window. Learn its calculation, auction choices, breakout rules, and limits.
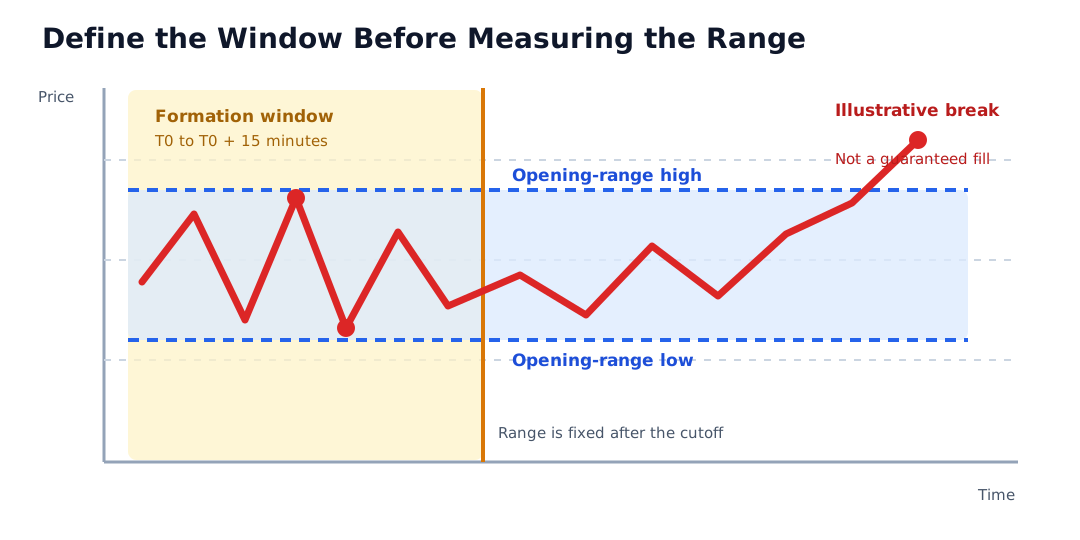
The opening range is the highest qualifying price minus the lowest qualifying price during a pre-defined interval after a selected trading session begins. It is commonly displayed as an upper and lower boundary that traders use to describe early price discovery and later intraday movement.
An opening range is not a universal market field. The analyst must define the venue or instrument, session, timezone, measurement window, eligible prices, and treatment of any opening auction. A move beyond the range is an observation, not a guaranteed signal or fill.
Key Takeaways
- The opening range is an early-session high-low band, not merely the opening price.
- Five-, 15-, 30-, and 60-minute windows are analyst conventions, not one universal standard.
- The session start and opening-auction treatment can materially change both boundaries.
- Range formation, a boundary crossing, breakout confirmation, an order trigger, and an execution are separate events.
- Range width provides volatility context but does not predict direction by itself.
- Early trading can involve wide spreads, rapid repricing, gaps, and failed breakouts.
How to Define the Opening Range
A reproducible opening range needs more than a duration. Record each input before measuring it:
| Input | Example convention | Why it matters |
|---|---|---|
| Instrument | One named stock and share class | Different instruments have different trades and sessions |
| Venue or data source | Consolidated trades or one exchange | High and low can differ by coverage |
| Session | Regular trading session | Avoids mixing pre-market, overnight, and core-session data |
| Timezone | Venue-local time | Prevents timestamp ambiguity |
Start time, T0 | Selected session open | Defines the measurement anchor |
| Window | From T0 through, but not including, T0 + 15 minutes | Makes boundary treatment explicit |
| Price field | Highest and lowest qualifying trade | Bid, ask, midpoint, and trade prices are not interchangeable |
| Auction treatment | Include the official opening-auction print | Auction prices can alter the range |
| Corrections | Exclude canceled trades and apply final corrections | Bad or corrected prints can distort extremes |
The interval notation matters at bar boundaries. If a 15-minute range starts at 9:30:00, one method includes timestamps from 9:30:00 through 9:44:59.999 and begins later evaluation at 9:45:00. Another data vendor may label or aggregate bars differently. The documentation should remove that ambiguity.
Opening Auctions and the Session Start
An exchange open can be an auction process rather than a single ordinary continuous-market trade. For example, NYSE publishes opening-auction procedures and notes that an NYSE-listed security may be opened by its designated market maker after the nominal 9:30 a.m. process begins.
That creates several possible definitions:
- start the window at a scheduled clock time;
- start it when the instrument’s official opening auction completes;
- include the auction print in the first interval;
- exclude the auction and use continuous trading only; or
- include extended-hours activity before the core session.
None of these choices should be hidden. A delayed opening, trading halt, or missing auction can otherwise make two charts with the same stated duration produce different ranges.
Worked Example
Assume an analyst defines a 15-minute opening range as follows:
- selected session begins at 9:30:00 a.m. venue time;
- measurement window is 9:30:00 through 9:44:59.999;
- the official opening-auction print is included;
- qualifying regular-session trades are used; and
- later analysis starts at 9:45:00.
The highest qualifying trade during the window is $101.20, and the lowest is $99.80.
Opening-range width = $101.20 - $99.80 = $1.40
The midpoint is:
($101.20 + $99.80) / 2 = $100.50
Range width as a percentage of the midpoint is:
$1.40 / $100.50 x 100 = 1.39%, rounded to two decimal places
The finished range is therefore $99.80 to $101.20, with a width of $1.40. It says nothing by itself about whether the next move will be higher or lower.
Suppose a later five-minute bar trades as high as $101.62 but closes at $101.10:
- an any-trade rule records an upside crossing because $101.62 exceeded $101.20;
- a five-minute close rule does not confirm a break because $101.10 remained below $101.20; and
- a 0.5% filter would require $101.20 x 1.005 = $101.71, rounded to the nearest cent, so the high did not satisfy that filter.
A later close at $101.80 would satisfy both the close-based and 0.5% filtered rules. These are alternative definitions, not proof that one method is best.
Formation, Breakout, and Execution
| Stage | What is measured | Evidence required |
|---|---|---|
| Range formation | High and low during the selected opening window | Timestamped eligible price data |
| Completed range | Final boundaries after the window closes | Stable session and interval rules |
| Boundary crossing | A qualifying price moves outside a boundary | Defined price field and timestamp |
| Breakout confirmation | A close, duration, percentage, volume, or other filter is met | Pre-declared confirmation rule |
| Order trigger | Broker or venue activates an instruction | Order record and trigger conditions |
| Execution | Some or all quantity trades | Execution report, price, size, venue, and fees |
A chart can show a crossing even when no order was entered. An order can trigger without filling at the boundary. A limit order can remain unfilled, and a market or stop order can execute at a different price during fast trading.
Opening Range vs. Related Terms
| Term | Meaning | Main distinction |
|---|---|---|
| Opening Price | Official or qualifying price used to represent the session open | One price rather than a high-low interval |
| Opening range | High-low band over a defined early-session window | Requires a duration and eligibility rules |
| OHLC Chart | Open, high, low, and close for each selected period | General price-bar format, not one special session window |
| Price Gap | Separation between one price reference and a later open or range | Compares periods rather than defining the early band |
| Breakout | Movement beyond a defined boundary | Event that may occur only after the opening range is complete |
What Opening-Range Width Can Show
Opening-range width describes the observed early price span. Analysts may compare the dollar or percentage width with prior sessions, a volatility estimate, or the instrument’s price.
A relatively wide range can reflect important news, an opening imbalance, a gap, thin liquidity, or ordinary volatility. A narrow range can reflect balanced trading, low activity, or delayed price discovery. Width alone does not identify the cause or forecast the direction of the next move.
Comparisons also require consistent units. A $2 range has different significance for a $20 instrument and a $500 instrument. Percentage width improves scale comparison but still does not adjust for every difference in tick size, volatility, liquidity, or market structure.
Different Markets Need Different Conventions
Opening-range analysis is easiest when an instrument has a clearly defined exchange session. Other markets require extra choices:
- Exchange-listed stocks: Specify core or extended hours and whether the official auction print is included.
- Futures: Identify the contract month, trading session, exchange timezone, and treatment of overnight activity.
- Foreign exchange: Define a regional or strategy-specific session boundary because trading is decentralized and spans time zones.
- Crypto assets: Define an arbitrary daily or regional boundary because many venues operate continuously.
- Multiple listings or venues: State whether the data are consolidated or venue-specific.
An opening range from one market should not be applied mechanically to another without matching its trading calendar and data structure.
How to Evaluate an Opening-Range Claim
- Verify the instrument, venue, timezone, and trading calendar.
- Define the session start and the exact beginning and end of the window.
- State whether opening auctions, extended hours, halts, and delayed opens are included.
- Identify the eligible price field and correction policy.
- Complete and preserve the range before evaluating later prices.
- Define crossing, confirmation, failure, and retest rules separately.
- Compare range width using consistent units and historical samples.
- Include spread, depth, slippage, non-fill, fees, and gap risk in any strategy test.
- Keep failed and ambiguous outcomes rather than showing only successful examples.
Risks and Common Mistakes
- Undefined window: Calling a range “the opening range” without stating its duration.
- Session mismatch: Comparing regular-session data with a chart that includes extended hours.
- Auction ambiguity: Failing to state whether the official opening print is included.
- Boundary leakage: Using data from after the window to revise its high or low.
- Confirmation drift: Changing from an intraday crossing to a closing rule after seeing the result.
- Outlier risk: Letting a bad, canceled, or unusually small print define an extreme.
- False breakout: Assuming the first move outside the band must continue.
- Execution risk: Treating a chart boundary as a guaranteed transaction price.
- Overfitting: Selecting the window and filter that best fit one instrument or historical period.
- Causation error: Treating a wide or narrow range as proof of one market narrative.
Public Source Checks
- NYSE: Auctions publishes exchange-specific opening-auction timelines and procedures, illustrating why auction and venue choices belong in the range definition.
- Investor.gov: Types of Orders explains the different execution and price characteristics of market, limit, and stop orders.
- Investor.gov: Executing an Order explains routing and why an investor’s execution may differ from the quote seen on screen.
Related Terms
- Stock Quote Price Fields: Opening, high, low, closing, bid, ask, and last-sale data definitions.
- OHLC Chart: Display of the four fields used to summarize each range interval.
- Horizontal Line: Fixed-price drawing commonly used to extend the completed boundaries.
- Price Gap: Separation between a prior reference and a later opening price or range.
- Breakout: Price movement beyond a pre-defined boundary.
- Trading Volume: Completed activity that may be compared across the opening window and later periods.
FAQs
How long is the opening range?
Does the opening auction count in the opening range?
Is a trade above the opening-range high a confirmed breakout?
Does a wide opening range predict a down day?
Can an opening-range order fill at the boundary?
Educational Use
This article provides general market education. It does not provide personalized investment or trading advice and does not recommend an instrument, opening-range window, breakout rule, order, or strategy.