Downtrend in Technical Analysis
A downtrend is a falling swing structure with lower highs and lower lows on a stated timeframe. Learn how it is identified, weakened, and evaluated.
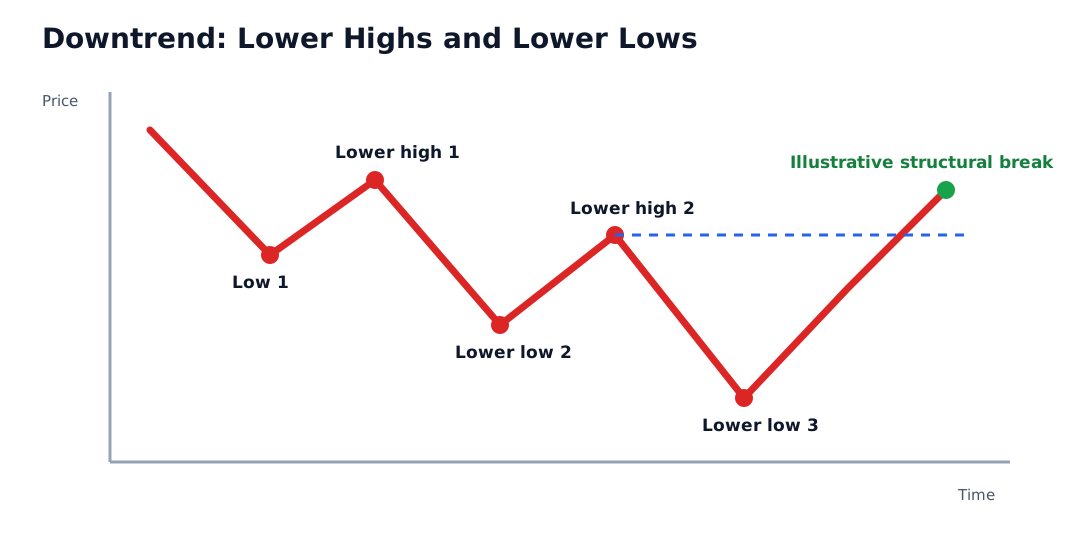
A downtrend is a falling price structure in which meaningful swing highs and swing lows generally progress downward over a stated timeframe. A common definition requires at least one lower high and one lower low after an initial swing pair. It describes observed weakness, not a guarantee that price will continue falling.
The selected swing rule, timeframe, price field, and invalidation condition control the label. A daily downtrend can occur inside a weekly uptrend, and a break above one swing high may lead to a range rather than a lasting reversal.
Key Takeaways
- Lower lows show that declines exceeded earlier swing lows; lower highs show that rebounds ended below earlier swing highs.
- A swing high or low is normally recognized only after later bars move away from it.
- One large decline does not necessarily establish a downtrend.
- A break above the latest lower high weakens many structural definitions but does not automatically establish an uptrend.
- Price weakness does not by itself establish insolvency, poor fundamentals, or fair value.
- Selling an existing long and opening a short position are different decisions with different risks.
How Lower Highs and Lower Lows Work
A swing low is a local trough surrounded by higher prices. A swing high is a local peak surrounded by lower prices. Small fluctuations occur constantly, so an analyst needs a threshold for deciding which swings count.
Possible definitions include:
- a fixed number of bars on each side of an extreme
- a minimum percentage or volatility-adjusted reversal
- closing prices rather than intraday highs and lows
- a manually selected hierarchy of major and minor swings
A sensitive rule detects changes quickly but can create frequent false classifications. A broader rule filters noise but recognizes the turn later.
Worked Example
Suppose a daily chart contains these confirmed swings:
| Swing | Day | Price | Structural role |
|---|---|---|---|
| High 1 | 5 | $100 | Initial high |
| Low 1 | 11 | $90 | Initial low |
| High 2 | 17 | $96 | Lower high |
| Low 2 | 24 | $84 | Lower low |
| High 3 | 30 | $91 | Second lower high |
| Low 3 | 38 | $78 | Second lower low |
The series supports a downtrend label under a lower-high and lower-low rule. If price later closes at $92, it has moved above the $91 latest lower high and weakens this specific structure.
That close does not yet prove an uptrend. A structural uptrend may require a higher pullback low followed by a higher high. Price could instead form a broad range, fail near $96, or resume declining.
Swing Recognition Is Delayed
The $78 low on day 38 is not known to be a swing low at the instant it trades. If the rule requires two later bars with higher lows, the earliest recognition is day 40. A historical test that buys or covers at the exact day-38 low without accounting for this delay uses unavailable information.
Keep separate records for:
- extreme timestamp
- confirmation timestamp
- signal timestamp
- order submission
- actual or simulated fill
Downtrend Across Multiple Timeframes
| Observation | Possible reading |
|---|---|
| Hourly lower highs and lows | Short-term downtrend |
| Daily range | No clear intermediate direction |
| Weekly higher highs and lows | Long-term uptrend |
The hourly decline may be a pullback within the weekly advance, but that interpretation also needs a rule. Calling price merely bearish hides which horizon matters.
Downtrend vs. Related Concepts
| Concept | What it describes | Key distinction |
|---|---|---|
| Downtrend | Falling sequence of meaningful swings | Price structure on a stated timeframe |
| Falling Trend Line | Diagonal line through selected lower highs | Analyst-drawn tool, not the trend itself |
| Negative momentum | Rate or persistence of recent losses | Can improve while price still makes lower lows |
| Bear Market | Broad, sustained market decline | Usually wider and longer in scope |
| Market Correction | Decline from a recent peak | Describes drawdown, not necessarily swing structure |
A financially strong issuer can enter a downtrend, and a distressed issuer can experience a sharp uptrend. Chart direction and financial condition are related only through evidence, not labels.
What Can Weaken or End the Structure?
Possible rules include:
- close above the latest meaningful lower high
- formation of a higher low followed by a higher high
- break above a falling trend line under a stated buffer
- moving-average or price-channel condition
- failure to make a new low within a defined time
A break rule should identify whether intraday price, close, percentage distance, volatility buffer, or multiple bars count. No filter removes the risk of a false reversal.
Different Decisions From the Same Chart
| Reader | Possible decision question | Distinct risk |
|---|---|---|
| Long investor | Does the price structure require a thesis or exposure review? | Selling from price alone may ignore fundamentals and tax consequences |
| Trend follower | Does the rules-based method require less long exposure? | Signal may react after a large decline |
| Short seller | Does the method permit a short position? | Loss can grow as price rises; borrow and margin matter |
| Hedger | Does a defined exposure justify protection? | Hedge cost and basis risk can outweigh the benefit |
The downtrend does not answer any of these questions by itself.
Short Selling Is Not the Opposite of Holding Cash
Short Selling generally requires borrowed securities and a margin account. Risks can include:
- losses that increase as price rises
- changing borrow fees or unavailable borrow
- buy-ins or recalls under account and lending arrangements
- obligations related to distributions
- gaps and squeezes beyond the planned exit
A valid downtrend can coexist with a poor short entry if the move is extended, liquidity is weak, or borrow cost is high.
From Trend Observation to Execution
A downtrend label does not specify an order. A strategy must define:
- signal and recognition time
- entry, reduction, hedge, or stand-aside decision
- order type and acceptable price
- position and loss limit
- response to a gap above the intended exit
- fees, spread, borrow cost, and market impact
Market orders prioritize execution rather than price. Limit orders control price but may not execute. Stop orders can trigger during fast conditions and fill away from the selected level.
How to Evaluate a Downtrend Claim
- Identify the instrument, data source, and price adjustments.
- State the chart interval and observation window.
- Define swings without future leakage.
- List the exact highs and lows supporting the label.
- Specify the event that weakens or ends the trend.
- Document conflicting shorter and longer timeframes.
- Separate signal recognition from executable price.
- Test rallies, ranges, and failed declines, not only sustained selloffs.
Risks and Common Mistakes
- Classifying one sharp loss as a complete swing trend.
- Selecting only swing points that preserve a bearish conclusion.
- Treating the final low as known before later bars confirm it.
- Switching timeframe after price rallies.
- Equating market weakness with insolvency or permanent loss.
- Chasing an extended decline with no failure rule.
- Assuming a falling trend line guarantees resistance.
- Ignoring gaps, spread, liquidity, leverage, borrow, and squeeze risk.
Public Source Checks
- CFTC: Commodity Trading Systems Sold on the Internet warns that hypothetical results may omit spreads, execution effects, costs, losses, and margin pressures.
- Investor.gov: Types of Orders explains market, limit, and stop-order mechanics.
- Investor.gov: Executing an Order explains why displayed and actual execution prices can differ.
- FINRA: Risk provides broader investor education about investment risk.
Related Terms
- Market Trend: The broader framework for upward, downward, and sideways structure.
- Uptrend: A sequence of higher highs and higher lows.
- Trend Line: An analyst-drawn line through selected reaction points.
- Pullback: A temporary decline that may occur inside a broader advance.
- Short Selling: A position structure with borrow, margin, and potentially large-loss risk.
FAQs
Does one lower low create a downtrend?
When does a downtrend end?
Is every downtrend a bear market?
Does a downtrend make short selling appropriate?
This article provides general chart-reading education, not a market forecast, short-sale instruction, or personalized investment recommendation.