Horizontal Line in Technical Analysis
A horizontal line marks one constant chart price. Learn how traders choose levels, convert them into zones, define breaks, and avoid hindsight bias.
A horizontal line in technical analysis is a drawing placed at one constant price across a chart. Analysts use it to mark a prior high or low, the center of a support or resistance area, a range boundary, an opening-range level, or another price reference.
The line is a visual annotation, not an order, valuation, or prediction. Its usefulness depends on how the price was selected, which data and timeframe were used, and what rule defines a later touch or break.
Key Takeaways
- A horizontal line has the same price value at every point in time.
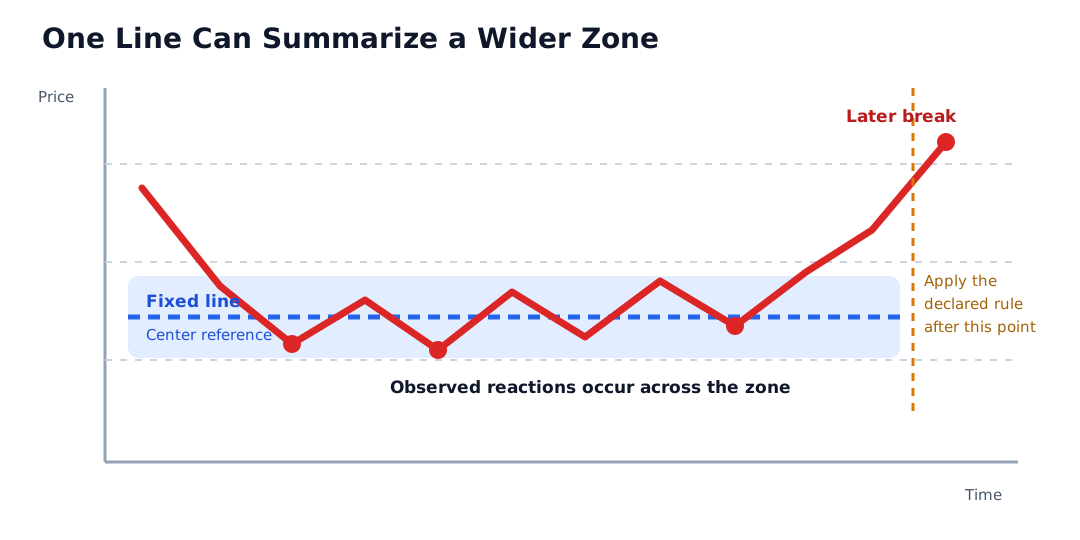
- The line often summarizes a wider reaction zone rather than one exact executable price.
- A reproducible level needs a stated instrument, timeframe, session, price field, and anchor method.
- A touch, intraday crossing, closing break, and successful retest are different events.
- Drawing a level after seeing the outcome creates selection and hindsight bias.
- A clean crossing on a chart does not guarantee an order fill at the marked price.
How a Horizontal Line Is Constructed
A horizontal line is simple geometrically: choose a price and extend that value through time. The analytical judgment lies in choosing the price.
Before drawing the line, document:
- Instrument: Security, share class, currency, contract month, and venue or data source.
- Timeframe: Tick, minute, hourly, daily, weekly, or another interval.
- Session: Regular, extended, overnight, or combined trading hours.
- Price field: Trade high, trade low, close, settlement, bid, ask, or another defined field.
- Adjustment basis: Treatment of splits, distributions, futures rolls, and data corrections.
- Anchor rule: Prior swing, repeated reaction cluster, round number, range boundary, or another method.
- Tolerance: Whether the line represents an exact value or the center or edge of a wider zone.
Two analysts can draw different lines on the same chart without either calculation being mechanically wrong. The difference should come from stated methods, not unexplained visual preference.
Worked Example: One Line, One Zone
Assume a daily chart shows three prior lows at $49.85, $50.10, and $49.95. An analyst uses $50.00 as a simple central reference and defines the reaction zone as $49.75 to $50.25 before reviewing later prices.
The setup contains three distinct values:
| Item | Value | Meaning |
|---|---|---|
| Horizontal line | $50.00 | Central visual reference |
| Lower zone boundary | $49.75 | Bottom of the allowed reaction area |
| Upper zone boundary | $50.25 | Top of the allowed reaction area |
A later decline reaches $50.18 and closes at $49.90. Price crossed the $50.00 line and remained inside the wider zone. It would be inaccurate to say that the line held exactly or that the zone broke.
Now assume the analyst defines an upside break as a close at least 0.5% above $50.25:
$50.25 x 1.005 = $50.50125, or $50.50 when rounded to the nearest cent
A later intraday high of $50.54 with a close of $50.12 crosses the filtered threshold during the session but does not satisfy the close-based rule. A close at $50.62 would satisfy it. The same price path can therefore produce different labels under different rules.
This example does not show that 0.5% is the correct filter. It shows why the filter, price field, and rounding convention must be declared before evaluating the result.
Horizontal Line vs. Price Zone
| Feature | Exact line | Price zone |
|---|---|---|
| Representation | One price | Lower and upper boundary |
| Visual benefit | Precise and uncluttered | Better reflects clustered reactions |
| Main risk | False precision | Subjective width |
| Break rule | Price moves beyond one value | Price moves beyond the far boundary |
| Reproducibility need | Explain the selected price | Explain both boundaries and how they were set |
A line can still be useful when the analysis treats it as shorthand for a zone. Problems arise when a thin mark is presented as a guaranteed floor, ceiling, or fill price.
Horizontal Line vs. Related Chart Tools
| Tool | What changes through time? | Typical use | Main distinction |
|---|---|---|---|
| Horizontal line | Nothing; price stays constant | Prior high, prior low, support, resistance, or range edge | Fixed price reference |
| Trend Line | Price level slopes with time | Rising support or falling resistance | Depends on selected time-price anchors |
| Moving Average | Recalculates as observations enter and leave | Rolling trend or dynamic reference | Formula-derived rather than manually fixed |
| Opening Range | Boundaries are fixed after a selected opening window | Intraday context | Uses two measured early-session extremes |
Touch, Break, and Retest Are Different
These labels should not be used interchangeably:
- Touch: A qualifying price reaches the line or enters the zone.
- Cross: A qualifying price prints on the other side of the line.
- Break: Price satisfies a pre-declared rule beyond the line or zone, such as a closing-price or percentage filter.
- Retest: Price returns toward the former boundary after a break.
- Hold: The retest remains within the analyst’s tolerance and later moves away in the expected direction.
- Failed break: Price satisfies the break rule but later returns through the boundary under a separate failure rule.
A wick through a line, a one-minute close beyond it, and a daily close beyond a zone are materially different observations. The chart label should identify which one occurred.
Selection Bias and Reproducibility
Horizontal lines are easy to add after the outcome. A chart with many possible highs, lows, closes, gaps, and round numbers will almost always contain a line near a later turning point.
To reduce hindsight bias:
- save or timestamp the level before the test;
- limit the number of levels under review;
- state the lookback period and minimum number of reactions;
- keep unsuccessful and ambiguous levels in the evaluation sample;
- avoid moving the line to fit each new bar; and
- test the same rule across comparable instruments and market conditions.
A visually persuasive example is not evidence that a method works repeatedly after costs.
Data and Corporate-Action Checks
A historical level can move or lose meaning when the underlying data change. Verify whether the chart is adjusted for stock splits and distributions, whether a futures series has been rolled or back-adjusted, and whether bad ticks or canceled trades were removed.
Session settings also matter. A prior high on a regular-hours chart can differ from the high on a chart that includes extended trading. Bid, ask, last-sale, and closing prices can place the apparent level at different values.
From Chart Reference to Execution
A horizontal line is not an executable quote. If price approaches a marked level:
- a market order seeks execution but does not guarantee a price;
- a limit order controls the worst acceptable price but may not execute;
- a stop order becomes active only after its trigger condition and may fill away from the stop price; and
- a price gap can move across the line without an opportunity to trade at it.
Spread, available depth, latency, order priority, volatility, and venue routing can all make the transaction record differ from the chart. Any review should compare the signal timestamp with the order, execution, fee, and position records.
How to Evaluate a Horizontal Level
Use this checklist before relying on a marked price:
- Can another analyst recreate the line from the stated data and rule?
- Is the level one price or shorthand for a defined zone?
- Was it marked before the outcome?
- Which price field counts for a touch or break?
- Does the timeframe match the intended holding period?
- Are the historical prices adjusted consistently?
- Is the level still relevant after new information or a volatility change?
- What observation invalidates the interpretation?
- What order behavior, non-fill, slippage, and loss could follow?
Risks and Common Mistakes
- False precision: Treating one plotted value as a guaranteed reaction price.
- Chart clutter: Drawing enough lines that nearly every outcome appears to confirm one.
- Hindsight bias: Selecting or moving a level after seeing later prices.
- Timeframe mismatch: Using a minute-chart level to support a long-horizon conclusion without other evidence.
- Stale data: Ignoring news, corporate actions, contract rolls, or regime changes.
- Field mismatch: Comparing a last-sale level with bid, ask, settlement, or adjusted-close data.
- False-break risk: Treating the first crossing as durable confirmation.
- Execution risk: Assuming the chart price was available for the required quantity.
- Valuation confusion: Treating technical support as evidence that an asset is inexpensive or financially sound.
Public Source Checks
- Investor.gov: Support and Resistance provides the SEC investor-education glossary context for technical price levels associated with demand and supply.
- Investor.gov: Types of Orders distinguishes market, limit, and stop instructions and their price or execution tradeoffs.
- Investor.gov: Executing an Order explains why a displayed price and an actual execution can differ.
- FINRA: Market Data Frequently Asked Questions explains investor-facing market-data fields and limitations.
Related Terms
- Support and Resistance: Market behavior around reaction zones commonly marked with horizontal lines.
- Breakout: Movement beyond a pre-defined chart boundary.
- Trend Line: Sloped reference derived from selected time-price points.
- OHLC Chart: Chart showing the price fields that may be used to define a test or break.
- Stock Quote Price Fields: Definitions and caveats for open, high, low, close, bid, ask, and last-sale data.
FAQs
Is a horizontal line the same as support or resistance?
Should a horizontal level be an exact price or a zone?
What counts as a break of a horizontal line?
Can a horizontal line predict a reversal?
Educational Use
This article provides general market education. It does not provide personalized investment or trading advice and does not recommend any security, level, order, or strategy.