Bollinger Bands
Bollinger Bands explained: moving-average and standard-deviation formulas, bandwidth, a calculation example, practical interpretations, and limitations.
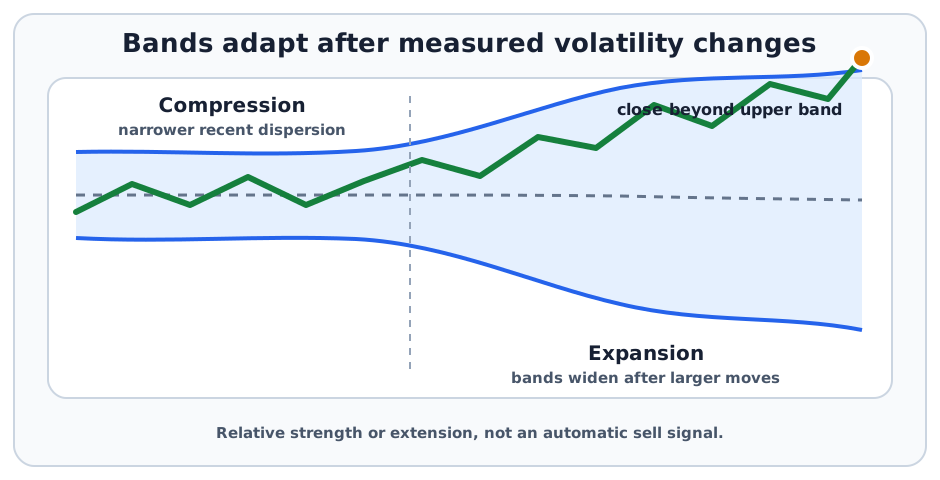
Bollinger Bands are volatility-adjusted price bands placed above and below a moving average. The common configuration uses a 20-period simple moving average and bands two standard deviations away, creating a relative framework for judging whether price is high or low compared with its recent distribution.
A band touch is not automatically a reversal signal. In a strong trend, price can repeatedly move along or beyond one band.
Key Takeaways
- The middle band is usually a moving average; the outer bands expand and contract with recent standard deviation.
- Common defaults are 20 periods and a multiplier of 2, but settings must be stated.
- BandWidth describes relative band width, while
%Bdescribes price location within the bands. - Narrow bands indicate lower recent dispersion, not certainty that a breakout is imminent.
- The bands are based on historical prices and do not create a normal-probability forecast.
Formula
For lookback n and standard-deviation multiplier k:
where sigma is the standard deviation of the selected price series over the same lookback.
Two related measures are:
%B = 1 places price at the upper band, 0.5 at the middle of the bands, and 0 at the lower band. Values can exceed 1 or fall below 0.
Simple Example
Suppose a stock’s 20-day moving average is $100, its 20-day standard deviation is $2, and k = 2.
A close at $105 is above the upper band. It shows that the close is high relative to this moving average and standard-deviation setting. It does not establish that the stock must decline or that $105 is fundamentally expensive.
How Bollinger Bands Are Interpreted
| Observation | What it describes | What it does not prove |
|---|---|---|
| Price near upper band | High relative price within the current envelope | Price is overvalued or must fall |
| Price near lower band | Low relative price within the current envelope | Price is undervalued or must rise |
| Bands narrow | Recent price dispersion declined | The timing or direction of a breakout |
| Bands widen | Recent dispersion increased | Volatility will remain elevated |
| Price walks a band | Persistent directional movement | A risk-free trend |
The same upper-band touch can support a trend-following rule in one strategy and a mean-reversion observation in another. The trading rule, not the band itself, determines the interpretation.
Bollinger Bands Versus Fixed Envelopes
| Feature | Bollinger Bands | Fixed-percentage envelope |
|---|---|---|
| Center | Usually a moving average | Usually a moving average |
| Distance from center | Standard-deviation multiple | Fixed percentage |
| Response to volatility | Expands and contracts | Remains fixed unless parameters change |
| Main sensitivity | Price distribution and lookback | Chosen percentage and moving average |
Bollinger Bands are also distinct from range-based channels that use average true range instead of standard deviation.
How to Evaluate a Bollinger Rule
- Confirm the price field, lookback, moving-average type, standard-deviation convention, and multiplier.
- State whether the rule uses a touch, close beyond a band, return inside a band, BandWidth, or
%B. - Check whether the market is trending or range-bound.
- Test the rule on data not used to select its settings.
- Include spreads, fees, slippage, gaps, and realistic order timing.
Risks and Limitations
- Parameter sensitivity: Different lookbacks and multipliers materially change the bands.
- Distribution assumptions: Two standard deviations do not guarantee a fixed percentage of future prices will remain inside the bands.
- Lag: Both the moving average and standard deviation depend on historical observations.
- Band walking: Strong trends can remain near one band longer than a mean-reversion rule can tolerate.
- Volatility shock: Bands widen only after new price movement enters the calculation.
- Data differences: Adjusted prices, session boundaries, and vendor methods can change readings.
John Bollinger’s official explanation describes the bands as a relative-price framework and distinguishes BandWidth and %B. The CFTC Futures Glossary provides public definitions for volatility and technical analysis. Neither source guarantees the performance of a Bollinger-based rule.
FAQs
Does touching the upper Bollinger Band mean sell?
Does a Bollinger squeeze guarantee a breakout?
Are prices expected to stay inside the bands 95% of the time?
Related Terms
- Standard Deviation: A measure of dispersion around an average.
- Moving Average: A rolling average used as the middle band.
- Breakout: Price movement beyond a defined level or range.
- Price Volatility: Variation in market prices over time.
This article is educational and does not provide personalized investment or trading advice. Bollinger Bands cannot guarantee gains or limit losses.