Ascending Triangle Pattern
An ascending triangle combines rising reaction lows with horizontal resistance. Learn its construction, breakout rules, measured move, and failure risks.
An ascending triangle pattern is a narrowing price structure formed by rising reaction lows beneath a horizontal or nearly horizontal resistance zone. Analysts often watch for an upside break, but the shape can break downward, remain unresolved, or produce a false breakout.
The pattern is only a description until its points and rules are defined. A useful analysis identifies the prior trend, resistance zone, rising support line, completion rule, and failure condition before the outcome is known.
Key Takeaways
- Repeated tests of a similar upper zone form resistance; higher reaction lows form the rising boundary.
- A recognizable triangle is not the same as a completed pattern.
- A break can mean an intraday trade, close, percentage filter, multi-bar hold, or retest. The rule must be stated.
- Volume can describe participation but cannot prove that a breakout will continue.
- The triangle-height projection is illustrative geometry, not fair value or a guaranteed target.
- Execution price depends on order type, spread, depth, volatility, and gaps.
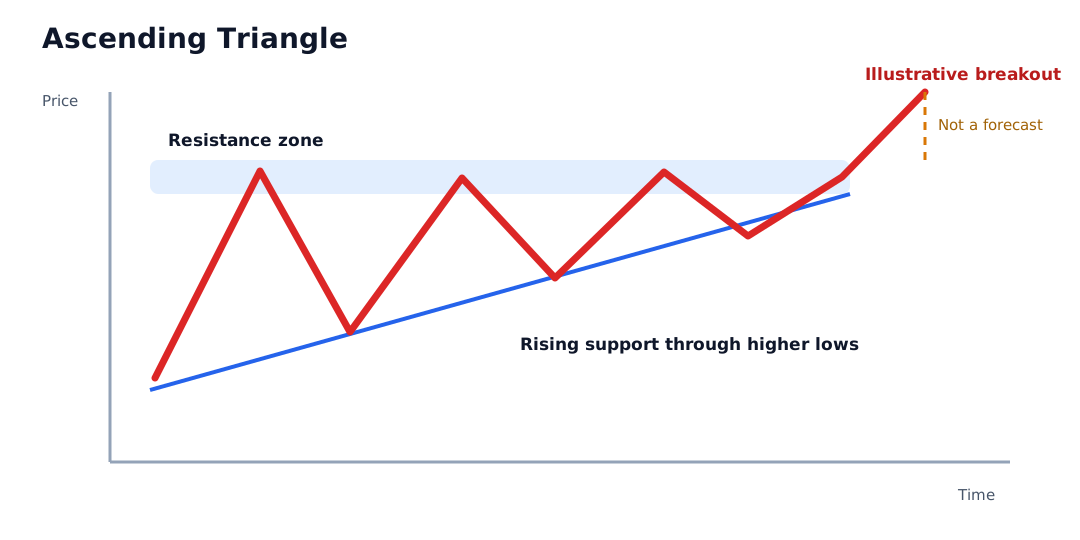
Pattern Anatomy
| Component | Construction | Analytical question |
|---|---|---|
| Prior price path | Trend or range before the triangle | Is the pattern continuation, reversal, or simply consolidation? |
| Resistance zone | Two or more reactions near a similar upper area | Was the zone visible before the attempted break? |
| Rising support | Line through higher reaction lows | Are the lows distinct and consistently measured? |
| Convergence | Distance between boundaries decreases | Is price actually compressing, or were lines forced onto noise? |
| Break event | Price crosses a pre-defined boundary | Which price field and threshold count? |
| Failure | Price returns inside or breaks the opposite side | What condition invalidates the setup? |
Resistance is usually better treated as a zone than a perfectly exact price. Differences caused by spreads, tick size, intraday highs, and closing prices can make repeated tests look unequal without changing the broader structure.
Worked Example
Suppose a daily chart has:
- a resistance zone from $49.80 to $50.20
- reaction lows at $44.00, $46.00, and $48.00
- a pre-declared rule requiring a close at least 0.5% above $50.00
- breakout-day volume of 1.6 million shares, compared with a 20-day median of 1.1 million
The filtered breakout threshold is:
$50.00 x 1.005 = $50.25
A close at $50.60 satisfies that price rule. It does not guarantee continuation. The next session could gap down, spreads could widen, or price could return to the resistance zone.
If the widest triangle height is measured from $44.00 to $50.00, the height is $6.00. Adding that amount to the $50.25 filtered break gives an illustrative projection of $56.25:
$50.25 + ($50.00 - $44.00) = $56.25
That projection is not a forecast, expected return, or valuation. A different anchor, zone edge, or logarithmic scale can produce a different number.
Candidate, Completion, and Execution
These stages should not be collapsed:
| Stage | What has happened | What has not happened |
|---|---|---|
| Candidate | Higher lows are pressing toward resistance | No boundary break is required |
| Completed under a rule | The selected break condition occurred | Follow-through is not guaranteed |
| Executable setup | An order, size, timing rule, and loss limit exist | Fill price is not guaranteed |
| Successful outcome | The pre-defined objective was achieved net of costs | One outcome does not validate the pattern generally |
Calling the candidate bullish before it breaks can introduce selection bias. Historical studies should include triangles that broke downward, drifted beyond the sample window, or stopped resembling triangles.
What Counts as an Upside Break?
Common definitions include:
- any intraday trade above the resistance zone
- a closing price above the zone
- a close beyond a fixed percentage or volatility-based buffer
- two consecutive closes above resistance
- an initial break followed by a retest that remains above the former resistance
None is universally correct. A stricter filter may exclude some false breaks but also enter later or miss fast moves. The chosen rule should be fixed before the chart is evaluated.
Volume and Participation
Rising volume near a break can indicate that more trading occurred, but volume does not identify buyer intent by itself. Activity can reflect new purchases, sales, short covering, hedging, index rebalancing, or forced liquidations.
A statement such as “volume confirmed the breakout” should identify:
- the volume field and trading venue
- the comparison baseline, such as a 20-day median
- whether the session was affected by an auction, expiry, rebalance, or news
- whether the instrument trades continuously or during limited hours
Ascending Triangle vs. Similar Structures
| Structure | Upper boundary | Lower boundary | Main distinction |
|---|---|---|---|
| Ascending triangle | Horizontal resistance zone | Rising support | Price range narrows toward the upper zone |
| Ascending Channel | Rising line | Roughly parallel rising line | Channel width remains approximately stable |
| Symmetrical triangle | Falling resistance | Rising support | Neither boundary is horizontal |
| Descending triangle | Falling resistance | Horizontal support | Mirror geometry, often watched for a lower break |
| Rising wedge | Rising, slower upper line | Rising, faster lower line | Both boundaries rise and converge |
Failure and Invalidation
A false upside break occurs when price crosses the resistance rule and then returns inside the pattern. Invalidation must be defined just as carefully as entry. Possible rules include a close back below the zone, a break below rising support, or a time limit with no follow-through.
Price breaking the lower boundary before an upside completion means the original setup did not resolve as expected. It does not automatically create a short trade. Borrow availability, gap exposure, unlimited-loss risk, and the broader trend still matter.
How to Evaluate an Ascending Triangle
- Record the instrument, adjustment method, timeframe, and chart scale.
- Mark the resistance zone and reaction lows without using future bars.
- Define an objective tolerance for “similar” highs and “higher” lows.
- State the price field and break threshold.
- Compare activity with a named volume baseline.
- Specify the failure condition and maximum holding window.
- Distinguish signal time from order submission and actual fill.
- Include incomplete and failed candidates in any performance test.
Risks and Common Mistakes
- Treating a flat-looking upper boundary as one exact price.
- Assuming an upward break because the pattern is called ascending.
- Redrawing support after each violation until the triangle appears valid.
- Using future data to select the cleanest reaction points.
- Presenting the height projection as fair value or a guaranteed target.
- Ignoring splits, distributions, contract rolls, or bad prints.
- Treating a stop trigger as a guaranteed fill.
- Ignoring spread, market depth, slippage, short-sale, and leverage risks.
Public Source Checks
- CFTC Futures Glossary describes charting as plotting price trends, average movements, volume, and open interest for technical analysis.
- Investor.gov: Types of Orders explains market, limit, and stop-order mechanics.
- Investor.gov: Executing an Order explains why the displayed quote may differ from the execution price.
- FINRA: Stop Orders in Volatile Markets discusses stop-trigger and execution risks during volatile trading.
Related Terms
- Breakout: Movement through a defined boundary under a stated rule.
- Support and Resistance: The broader framework for the triangle’s two boundaries.
- Ascending Channel: A rising structure whose boundaries are approximately parallel.
- Trend Line: The tool used to connect the higher reaction lows.
- Trading Volume: A participation measure that requires a defined comparison baseline.
FAQs
Is an ascending triangle always bullish?
How many resistance tests are needed?
Does higher volume confirm the breakout?
Is the triangle-height projection a price target?
This article provides general chart-reading education, not a market forecast, trading instruction, or personalized investment recommendation.