Wolfe Wave Pattern
A Wolfe Wave is a practitioner-defined five-swing chart pattern. Learn its point convention, time-dependent projection, subjectivity, and testing risks.
A Wolfe Wave is a practitioner-defined chart pattern that labels five alternating swing points inside a converging or channel-like structure and projects a possible move from point 5 toward a line through points 1 and 4. The method is subjective, and the projected line is not fair value, a guaranteed target, or evidence that price must reverse.
Descriptions of the pattern can differ. Any analysis should state exactly how the five points, boundary lines, entry event, projection, and invalidation rule were selected.
Key Takeaways
- Wolfe Wave is a five-swing labeling convention used by some technical traders, not a standardized market measure.
- Bullish and bearish variants reverse the direction of the points and expected move.
- The 1-4 line is time-dependent; it produces a different projected price on each future bar.
- Point 5 can be especially subjective because some conventions allow it to extend beyond the 1-3 boundary.
- A recognizable shape is not an order, and a reversal from point 5 is not guaranteed.
- Any performance claim should address look-ahead bias, failed candidates, costs, and sensitivity to point-selection rules.
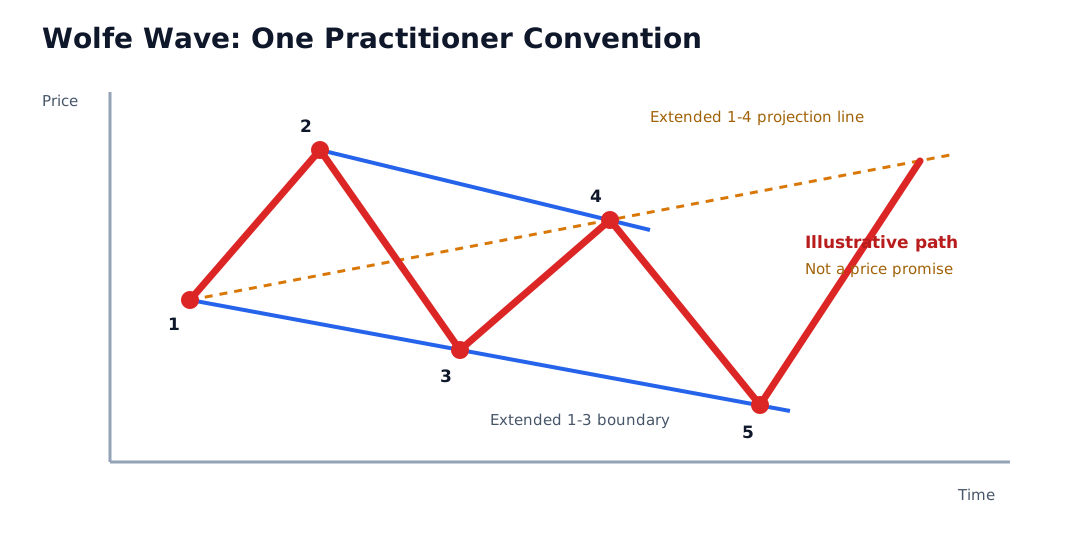
A Common Five-Point Convention
The diagram shows one bullish convention. It should be treated as a labeling framework, not the only possible definition.
| Point | Common bullish role | Selection problem |
|---|---|---|
| 1 | Initial reaction low | Lookback changes which low appears important |
| 2 | Reaction high after point 1 | Minor and major swings can compete |
| 3 | Later low, often below point 1 | Tolerance for the lower low must be defined |
| 4 | Later high, often below point 2 | Boundary and convergence rules can differ |
| 5 | Final low near or beyond the extended 1-3 line | Overshoot allowance is highly subjective |
| 1-4 line | Extended line used as a possible price-at-time reference | Its value changes with time |
For a bearish convention, highs and lows are inverted: points 1, 3, and 5 are upper swings, while points 2 and 4 are lower swings. The projected move is then downward toward the extended 1-4 line.
Worked Example: Why the Projection Moves
Assume a bullish labeling uses:
- point 1: $100 at bar 10
- point 2: $110 at bar 20
- point 3: $96 at bar 30
- point 4: $105 at bar 40
- point 5: $92 at bar 50
The slope of the 1-4 projection line is:
($105 - $100) / (40 - 10) = $0.1667 per bar
At bar 50, the line value is approximately:
$100 + (50 - 10) x $0.1667 = $106.67
At bar 60, its value is approximately:
$100 + (60 - 10) x $0.1667 = $108.34
The so-called estimated price-at-arrival therefore is not one fixed price. It depends on when, if ever, price reaches the extended line. Rounding, chart scale, anchor selection, and adjusted data can all change the result.
Candidate, Trigger, and Outcome
These stages should remain distinct:
| Stage | What is observed | What remains uncertain |
|---|---|---|
| Four-point structure | Points 1 through 4 can be labeled | Point 5 may not form |
| Five-point candidate | Point 5 reaches the selected area | Reversal may not begin |
| Trigger under a rule | Price satisfies a stated reversal or boundary condition | Order fill and follow-through |
| Projection contact | Price reaches the 1-4 line at a later time | Profit after costs or broader validity |
| Failure | Price violates the pre-declared invalidation rule | Whether another structure develops |
Entering automatically at the visually selected point 5 assumes that the point is known in real time. In practice, a swing low usually requires later bars before it can be identified as a local low. That delay must be included in a test.
How the Lines Are Drawn
The 1-3-5 Boundary
Points 1 and 3 establish one boundary. Point 5 is then evaluated against its extension. Some descriptions expect point 5 near the line; others permit an overshoot. Without a numerical tolerance, almost any nearby low can be accepted after the fact.
The 2-4 Boundary
Points 2 and 4 establish the opposite side of the structure. Whether the two boundaries must converge, remain channel-like, or satisfy a particular angle depends on the selected convention.
The 1-4 Projection
The extended line through points 1 and 4 is often called an estimated price-at-arrival line. Because it slopes through time, a report should state both the projected price and projected bar. Calling it a fixed target hides this dependence.
Wolfe Wave vs. Other Chart Frameworks
| Framework | Core structure | Main distinction |
|---|---|---|
| Wolfe Wave | Five alternating swing points plus a 1-4 projection line | Practitioner-defined geometry with substantial point-selection discretion |
| Ascending Channel | Two approximately parallel rising boundaries | Describes an ongoing path rather than a five-point reversal convention |
| Ascending Triangle | Rising lows beneath horizontal resistance | Uses a flat upper zone and boundary break |
| Double Top | Two similar peaks with an intervening neckline | Simpler reversal structure with a distinct completion boundary |
| General swing analysis | Sequence of reaction highs and lows | Does not require Wolfe numbering or a 1-4 projection |
Wolfe Wave should not be confused with an accounting, valuation, or economic-wave model. It is a chart-labeling method.
Evidence and Backtesting Problems
Look-Ahead Bias
The five points can look obvious only after the projected reversal occurs. A real-time test must define when each swing becomes observable and prevent later bars from changing earlier labels.
Selection Bias
Publishing only visually clean examples excludes incomplete and failed candidates. The test universe should include every candidate generated by the same rules.
Parameter Sensitivity
Results can change when the swing window, point tolerance, slope rule, timeframe, or point-5 overshoot changes. A robust claim should show that it does not depend on one unusually favorable setting.
Execution Assumptions
A test cannot assume a fill at the exact point-5 extreme because that low or high may be identifiable only later. Signal time, next available price, spread, slippage, fees, borrow, and gaps all matter.
See Backtesting for the broader distinction between a historical chart rule and an executable test.
How to Evaluate a Wolfe Wave Claim
- Write the five-point rules without seeing future bars.
- Specify the swing-identification window and confirmation delay.
- Define the chart scale, timeframe, and adjusted data series.
- State tolerances for boundary contact, convergence, and point-5 overshoot.
- Calculate the 1-4 line for a named future bar rather than citing one fixed target.
- Define trigger, invalidation, and maximum holding period.
- Include incomplete, failed, and unfilled signals.
- Report transaction costs and sensitivity to alternative reasonable parameters.
Risks and Common Mistakes
- Numbering swing points only after the reversal is visible.
- Changing point 1 or point 3 until point 5 fits the boundary.
- Treating a point-5 overshoot as unlimited.
- Calling the time-dependent 1-4 line a guaranteed price target.
- Assuming a local extreme could be traded before it was identifiable.
- Reporting selected examples instead of all rule-generated candidates.
- Ignoring spread, slippage, gaps, leverage, and short-sale constraints.
- Using chart geometry as a substitute for valuation or portfolio-risk analysis.
Public Source Checks
- CFTC Futures Glossary describes charting and technical analysis using price, average movements, volume, and open interest; it does not make any chart strategy predictive.
- Investor.gov: Types of Orders explains market, limit, and stop-order mechanics.
- Investor.gov: Executing an Order explains why actual execution can differ from a displayed price.
- FINRA: Stop Orders in Volatile Markets discusses trigger and execution-price risk for stop orders.
Related Terms
- Trend Line: The line-drawing tool used for the boundaries and projection.
- Support and Resistance: The broader framework for interpreting reaction points.
- Breakout: A boundary crossing that requires a pre-declared rule.
- Double Top: A simpler reversal candidate organized around two peaks and a neckline.
- Backtesting: Historical evaluation that must control look-ahead and selection bias.
FAQs
Is Wolfe Wave a standardized indicator?
What is the estimated price-at-arrival line?
Can point 5 be known in real time?
Does a Wolfe Wave predict a reversal?
This article provides general chart-reading education, not a market forecast, trading instruction, or personalized investment recommendation.