Candlestick
A candlestick displays an asset's open, high, low, and close for one period; its body and shadows summarize price movement but do not predict direction.
A candlestick is a price-chart mark that displays an asset’s open, high, low, and close (OHLC) for one defined period. Its body shows the distance between the open and close, while its upper and lower shadows show prices reached beyond the body.
A candlestick describes recorded price behavior; it does not reveal every trade, identify who bought or sold, or predict the next period. Interpretation depends on the instrument, venue, timeframe, session definition, data source, surrounding trend, liquidity, and subsequent price action.
Key Takeaways
- One candlestick represents four prices for one defined interval: open, high, low, and close.
- The real body spans the open and close; shadows, also called wicks, extend to the high and low.
- A bullish-colored candle means the close exceeded the open, not that the next price will rise.
- A long wick records a large intraperiod excursion; calling it rejection is an interpretation that needs context.
- Daily candles can differ across chart providers because sessions, time zones, corporate-action adjustments, and data feeds differ.
- Pattern names such as doji and hammer summarize geometry and location, not guaranteed reversals.
- Actual orders can fill at prices different from the candle’s displayed close or trigger level.
Candlestick Anatomy
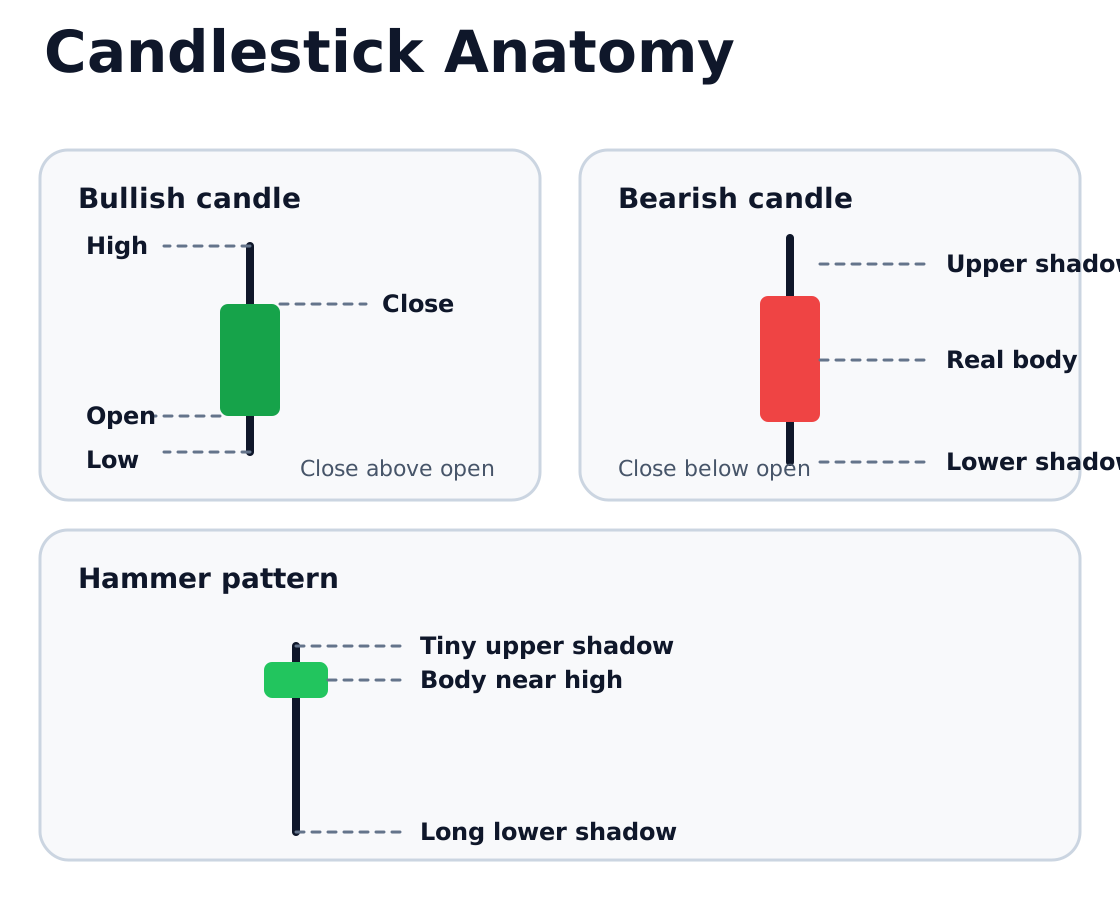
| Component | Definition | What it does not prove |
|---|---|---|
| Open | First eligible price in the defined interval | That every trader could transact at that price |
| High | Highest eligible price recorded in the interval | That significant volume traded there |
| Low | Lowest eligible price recorded in the interval | That the price established durable support |
| Close | Last eligible price under the chart’s interval rules | That an order submitted at the close received that price |
| Real body | Range between open and close | The amount of total trading activity |
| Upper shadow | Distance from the body’s upper edge to the high | That sellers caused a permanent reversal |
| Lower shadow | Distance from the body’s lower edge to the low | That buyers will defend the level again |
Chart colors are settings, not financial definitions. Many charts use green or hollow bodies when close is above open and red or filled bodies when close is below open, but other color conventions exist.
Worked Example
Assume a stock has these one-day prices:
| OHLC field | Price |
|---|---|
| Open | $48.00 |
| High | $52.50 |
| Low | $46.75 |
| Close | $51.00 |
Because the close is $3 above the open, the candle has a rising body from $48 to $51. Its upper shadow extends $1.50 from the body to the high, and its lower shadow extends $1.25 from the open to the low. The full daily range is:
$52.50 - $46.75 = $5.75.
The body occupies about 52% of that range:
($51.00 - $48.00) / $5.75 = 52.2%.
The candle shows that price closed above its opening level after trading both higher and lower. It does not show the sequence of every move. Price could have reached the high before the low or the low before the high; both paths can produce the same daily OHLC candle.
How the Timeframe Changes the Candle
The same transactions can produce very different chart shapes when grouped into one-minute, hourly, daily, or weekly intervals.
| Timeframe | Typical use | Main limitation |
|---|---|---|
| Intraday | Examining short-term price movement and execution context | More sensitive to bid-ask bounce, sparse trading, and feed differences |
| Daily | Summarizing one defined trading session | Session boundaries and closing-price rules must be checked |
| Weekly or monthly | Viewing broader price structure | Hides the order and volatility of moves within the period |
Lower timeframes do not automatically provide better information. They provide more observations, but those observations can contain more market microstructure noise and higher implementation costs.
Markets that trade nearly continuously require an arbitrary or venue-defined cutoff for daily candles. A cryptocurrency daily candle based on midnight UTC can differ from one based on another time zone even when both use accurate trades.
Session and Data Choices Matter
Before comparing two candlestick charts, check:
- regular-hours versus extended-hours trading;
- exchange-local time versus UTC or another time zone;
- consolidated versus venue-specific data;
- trade-price versus bid, ask, midpoint, or indicative data;
- treatment of corrected, canceled, or out-of-sequence trades;
- split- and distribution-adjusted versus unadjusted history; and
- whether the close is the last trade, an auction price, or an official settlement value.
See Stock Quote Price Fields for the market-data distinctions behind open, high, low, and close observations. A futures settlement price, for example, can be calculated under exchange rules rather than equal the final trade.
From Candles to Patterns
A single candle can be classified by its proportions, while a multi-candle pattern considers relationships across periods.
| Pattern term | Basic geometry | Context needed |
|---|---|---|
| Doji | Open and close are equal or very close | Prior trend, range, liquidity, and follow-through |
| Hammer | Small body near the high with a long lower shadow | Usually interpreted after a decline, then checked for confirmation |
| Hanging Man | Similar geometry to a hammer | Usually interpreted after an advance rather than a decline |
| Shooting Star | Small body with a long upper shadow | Prior advance and later confirmation matter |
| Engulfing pattern | Current real body spans the prior real body | Exact rules, gaps, trend, and subsequent movement vary |
The same geometry can receive a different name because of its location in the prior trend. This is one reason pattern recognition should use explicit rules rather than visual intuition alone.
What Candlesticks Can and Cannot Show
Candlesticks can efficiently show:
- direction from open to close;
- total high-low range;
- where the close sits inside the range;
- gaps between periods; and
- relative size compared with nearby candles.
They do not directly show:
- how much volume traded at each price;
- the order in which the high and low occurred;
- hidden or unexecuted orders;
- whether buyers or sellers were informed;
- the bid-ask spread throughout the period;
- fundamental value; or
- the probability of the next price move.
Volume, order-book, and transaction data can add context, but they do not turn a shape into certainty.
How to Evaluate a Candlestick Signal
- Identify the instrument, venue, data source, timeframe, and session.
- Verify the OHLC values and any corporate-action adjustment.
- Compare the candle’s body and range with recent volatility.
- Establish the prior trend and nearby support and resistance.
- Define the pattern rules and confirmation condition before seeing later prices.
- Check trading volume, spreads, gaps, and liquidity.
- Translate the observation into an order, invalidation level, position size, and maximum acceptable loss only if appropriate.
- Evaluate many signals, including failures, rather than highlighting only attractive charts.
Risks and Common Mistakes
- Treating a green candle as proof that buyers will remain in control.
- Calling every long shadow price rejection without transaction evidence.
- Reading a reversal pattern where no prior trend exists.
- Comparing candles built from different sessions or adjusted data.
- Assuming the candle records the path from open to high to low to close.
- Ignoring spreads, gaps, halts, and thin trading.
- Drawing a pattern after observing the future outcome.
- Using a chart signal as a personalized recommendation.
Public Source Checks
- CFTC Futures Glossary defines technical analysis using price, rate-of-change, volume, and open-interest patterns.
- Investor.gov: Executing an Order explains why the execution price can differ from the quote or price visible when an order is submitted.
- Investor.gov: Types of Orders distinguishes market, limit, and stop instructions from chart observations.
Related Terms
- OHLC Chart: A chart using the same open, high, low, and close observations with bar-style marks.
- Doji: A candle with little separation between open and close.
- Hammer: A reversal-style shape interpreted after a decline.
- Technical Analysis: The broader use of price, volume, volatility, and market activity to define testable trading rules.
- Moving Average: A rolling price smoother often overlaid on candlestick charts.
FAQs
Does a green candlestick mean the price will rise next?
Why can two platforms show different daily candles?
Does a long wick prove price rejection?
Can one candlestick identify a reversal?
This article provides general market-data and trading education, not personalized investment or trading advice. Candlesticks summarize historical prices and do not guarantee future direction or execution quality.