Breakout in Trading
A breakout occurs when price crosses a defined support, resistance, range, or pattern boundary. Learn how break rules, retests, and false breaks differ.
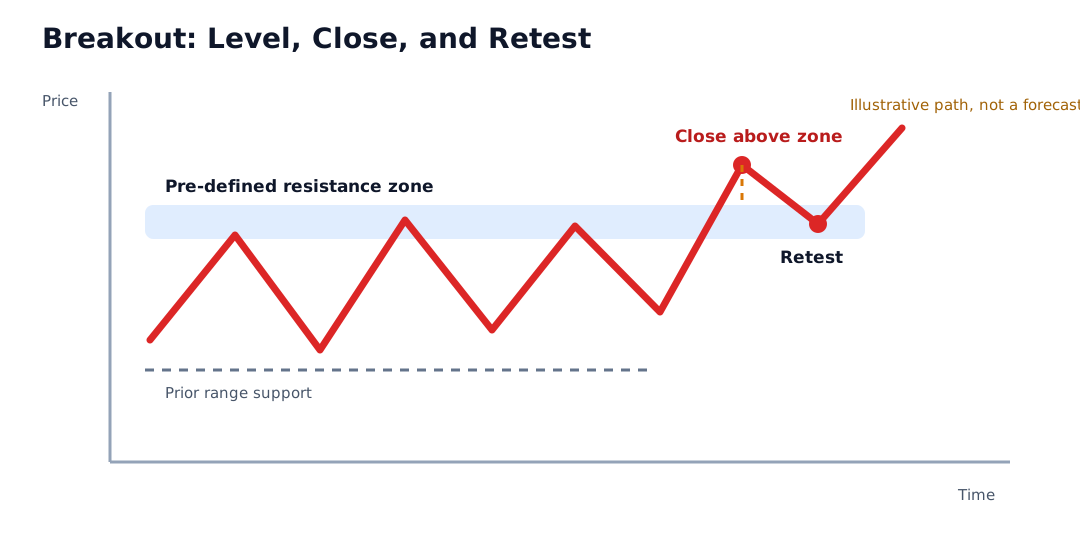
A breakout is a price move through a pre-defined support, resistance, range, trend-line, or chart-pattern boundary. An upside breakout crosses the upper boundary; a downside breakout, often called a breakdown, crosses the lower boundary. The event does not guarantee that price will continue in the same direction.
The word is incomplete without a rule. An analyst must identify the boundary, price field, timeframe, threshold, and observation window before deciding whether a breakout occurred.
Key Takeaways
- A breakout is an observed boundary crossing, not a forecast or an order.
- The reference line or zone should be visible before the crossing is evaluated.
- Intraday trade, closing-price, percentage-filter, multi-bar, and retest rules can classify the same price path differently.
- A retest is optional; price may continue without one or fail after one.
- Volume describes activity, not buyer or seller intent by itself.
- Spread, depth, order type, gaps, and latency can make the fill differ from the chart.
What Can Define the Boundary?
Breakout boundaries come from different observations:
| Boundary source | Example | Main judgment |
|---|---|---|
| Horizontal resistance | Repeated highs near $50 | Exact line or price zone |
| Horizontal support | Repeated lows near $42 | Which lows and tolerance define the floor |
| Trading range | Upper and lower reaction zones | Whether the range existed long enough to matter |
| Trend Line | Line through rising reaction lows | Anchor points, scale, and date-specific value |
| Chart pattern | Triangle, channel, neckline, or handle | Pattern must be defined before completion |
| Opening Range | First 15-minute high or low | Session, interval, venue, and trading hours |
A boundary often works better as a zone than a single decimal. Tick size, bid-ask spread, isolated trades, and differences between highs and closes can otherwise create false precision.
Worked Example: One Path, Three Rules
Assume a stock has a resistance zone from $49.80 to $50.20. Before the session, an analyst records three possible rules:
- Intraday rule: any trade above $50.20.
- Closing rule: daily close above $50.20.
- Filtered-close rule: daily close at least 0.5% above $50.20.
The filtered threshold is:
$50.20 x 1.005 = $50.45, rounded to the nearest cent
Now suppose day one reaches $50.70 but closes at $50.10. Day two closes at $50.60.
| Rule | Day one | Day two |
|---|---|---|
| Intraday trade above $50.20 | Breakout | Already triggered |
| Close above $50.20 | No breakout | Breakout |
| Close at or above $50.45 | No breakout | Breakout |
All three statements can be internally consistent because they answer different questions. A report that says only “price broke out” cannot be reproduced.
If price later falls to $50.25 and rises, that can be labeled a retest under a rule that treats the former resistance zone as support. It is not proof that the level caused the move or that another advance must follow.
Breakout, Confirmation, and Follow-Through
These terms should remain separate:
| Term | Meaning | What it does not establish |
|---|---|---|
| Breakout | Selected boundary-crossing rule occurs | Future return |
| Confirmation | An additional pre-defined condition occurs | Certainty |
| Retest | Price returns toward the crossed boundary | That the boundary will hold |
| Follow-through | Price continues in the break direction over a stated window | Long-term trend or fair value |
| False breakout | Price crosses and then violates a stated failure rule | That every future signal will fail |
“Confirmation” can refer to a close, volume threshold, second bar, volatility filter, breadth condition, or retest. The analyst should name the condition rather than use the word as if it had one universal meaning.
Common Breakout Contexts
Range Breakout
Price exits a horizontal trading range. The range duration, number of reactions, and width should be specified. A very narrow range can be smaller than normal noise or transaction cost.
Pattern Breakout
Price crosses a boundary from an Ascending Triangle, Cup and Handle, channel, or reversal structure. The pattern’s candidate and completion stages should not be collapsed.
Opening-Range Breakout
Price moves beyond a high or low formed during a pre-defined early-session window. Results are sensitive to the interval, venue, auction treatment, and whether overnight prices are included.
News or Gap Breakout
Price can open beyond a level after new information. The first executable price may be far from the boundary, so a chart signal measured at the old level can overstate the attainable result.
Volume and Market Participation
Volume can be compared with a named baseline, such as the 20-day median for the same session interval. A volume ratio of 1.5 means activity was 50% above that baseline; it does not reveal whether participants were informed, hedging, covering shorts, rebalancing, or trading for other reasons.
For exchange-traded derivatives, open interest is distinct from trading volume. One measures outstanding contracts after clearing updates; the other measures activity during a period. Neither validates a breakout by itself.
From Signal to Execution
A chart can record a trade above resistance even when no investor could fill at that exact displayed price and size. Keep these records separate:
- market-data timestamp and venue
- signal timestamp
- order submission and broker receipt
- order type and limit or stop terms
- partial fills, average fill, and fees
- subsequent failure or exit event
A market order prioritizes execution but not price. A limit order controls the acceptable price but may remain unfilled. A stop order can trigger during a fast move and execute away from the trigger.
How to Evaluate a Breakout Claim
- Identify the economic instrument and adjusted data series.
- Mark the level or zone without using future bars.
- State the timeframe, chart scale, and price field.
- Define the crossing, confirmation, and failure rules.
- Specify the evaluation horizon and cost assumptions.
- Compare volume or volatility only with a named baseline.
- Include failed breaks and signals that never filled.
- Report results across relevant market regimes rather than one favorable example.
Risks and Common Mistakes
- Drawing the level after seeing the move.
- Switching from an intraday rule to a close after a false break.
- Treating an isolated bad print as a valid crossing.
- Assuming high volume proves directional conviction.
- Assuming every breakout retests or every retest holds.
- Using the boundary as the assumed fill without slippage.
- Presenting range height as fair value or a guaranteed target.
- Ignoring gaps, short-sale constraints, leverage, spread, and liquidity.
Public Source Checks
- CFTC Futures Glossary describes charting and technical analysis using price, average movements, volume, and open interest.
- Investor.gov: Types of Orders explains the different execution tradeoffs of market, limit, and stop orders.
- Investor.gov: Executing an Order explains why quotes and actual execution prices can differ.
- FINRA: Stop Orders in Volatile Markets discusses trigger and fill risk for stop orders.
Related Terms
- Support and Resistance: Common sources of horizontal breakout boundaries.
- Trading Volume: Activity that should be compared with a stated baseline.
- Price Gap: A discontinuity that can move the first available fill away from the boundary.
- Opening Range: An early-session high-low interval used as a boundary.
- Neckline in Technical Analysis: A pattern boundary whose break rule must be specified.
FAQs
What confirms a breakout?
What is a false breakout?
Must price retest the breakout level?
Is a measured move a price target?
This article provides general chart-reading education, not a market forecast, trading instruction, or personalized investment recommendation.