Defensive Stock
A defensive stock represents a business expected to be less sensitive to economic cycles, but the label does not guarantee safety or positive returns.
A defensive stock is a share in a company whose demand, revenue, or earnings are expected to be less sensitive to economic expansions and contractions than those of the broad market or a cyclical peer. Non-cyclical stock is a closely related label that emphasizes comparatively stable business demand.
Defensive does not mean risk-free, recession-proof, low-volatility in every period, or guaranteed to pay dividends. It is a relative business-cycle classification that must be tested against the company’s actual operations, balance sheet, valuation, and market behavior.
Key Takeaways
- Defensive describes relative economic sensitivity, not absolute safety.
- Essential or recurring demand can support stability, but leverage, regulation, costs, and disruption still matter.
- Sector classification is a starting point; individual companies within the same sector can behave differently.
- Historical beta and drawdowns can support the analysis but do not prove future defensiveness.
- A stable business can be a poor investment when its valuation assumes too much stability or growth.
- Defensive, income, value, low-volatility, and blue-chip stocks are overlapping but distinct labels.
Defensive and Cyclical Sensitivity
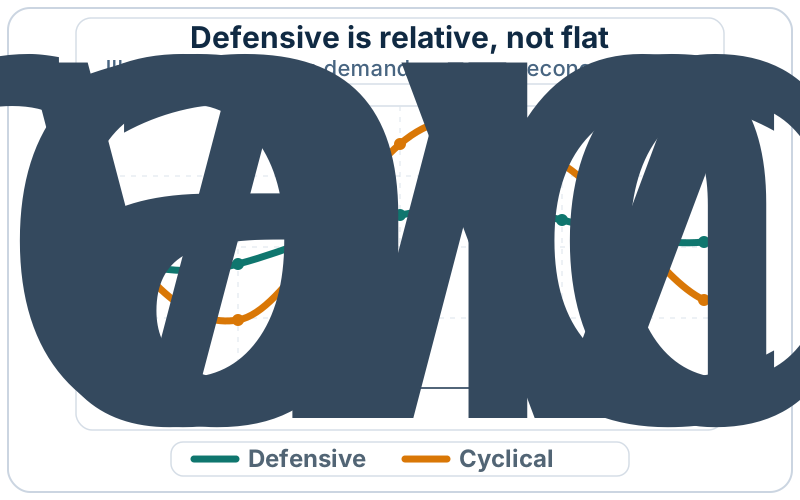
The diagram compares illustrative business sensitivity, not stock-price performance. A defensive company’s revenue can still decline, and a cyclical stock can rise before a recovery if the market already expects conditions to improve.
What Can Make a Business Defensive?
Common characteristics include:
- products or services customers continue to use when income or confidence weakens;
- recurring purchases, subscriptions, regulated demand, or contractual revenue;
- limited dependence on discretionary capital spending;
- relatively stable volumes and margins across prior cycles;
- manageable fixed costs and financial leverage; and
- sufficient liquidity to continue operating through stress.
Consumer staples are commonly treated as less cycle-sensitive. Utilities and parts of health care are also often described as defensive, but the broad label can conceal company-specific exposures such as regulation, reimbursement, commodity inputs, patents, weather, litigation, or debt.
Evidence to Examine
| Question | Useful evidence | Why the label can fail |
|---|---|---|
| Is demand resilient? | Volumes, cancellations, churn, customer mix, and same-store or comparable sales | Customers may trade down, delay use, or switch providers |
| Are margins stable? | Gross margin, operating margin, input costs, and pricing | Costs can rise faster than permitted or accepted price increases |
| Is cash flow dependable? | Operating cash flow, working capital, capital spending, and free cash flow | Accounting earnings can remain stable while cash conversion weakens |
| Is the balance sheet resilient? | Cash, debt maturities, interest coverage, covenants, and pensions | High leverage can overwhelm stable operations |
| Is the stock defensive? | Beta, drawdowns, downside capture, and stress-period returns | Historical market behavior may change with valuation or investor positioning |
| Is valuation reasonable? | Earnings, cash-flow, and dividend multiples versus scenarios and peers | Demand for perceived safety can produce an excessive price |
Evidence should cover more than one market or business-cycle episode when possible. A short period of stable results may reflect unusual pricing, temporary contracts, government support, or favorable costs rather than durable economics.
Worked Example: Business Stability Is Relative
Consider two simplified companies that each begin with $100 million of revenue and $10 million of operating profit.
| Measure | Defensive business | Cyclical business |
|---|---|---|
| Starting revenue | $100 million | $100 million |
| Revenue after slowdown | $95 million | $85 million |
| Variable costs after slowdown | $52.25 million | $51 million |
| Fixed operating costs | $35 million | $30 million |
| Operating profit after slowdown | $7.75 million | $4 million |
| Operating-profit decline | 22.5% | 60% |
The defensive business has variable costs equal to 55% of revenue and $35 million of fixed costs. The cyclical business has variable costs equal to 60% of revenue and $30 million of fixed costs. The defensive company experiences a smaller revenue decline, so its profit falls less even though its fixed-cost base is higher.
This example is deliberately simplified. Real results can include price changes, inventory write-downs, bad debts, restructuring, regulation, taxes, interest, and working-capital movements. The point is not that defensive earnings stay flat; it is that they may be less sensitive to the same economic slowdown.
Defensive Stock Versus Related Labels
| Label | Primary characteristic | What it does not establish |
|---|---|---|
| Defensive stock | Comparatively resilient demand or earnings | Positive return during every downturn |
| Cyclical stock | Greater sensitivity to economic activity | Poor quality or permanent decline |
| Income stock | Recurring dividend is an important return source | Stable business demand or dividend safety |
| Value stock | Price appears low relative to selected fundamentals | Defensive operations or low downside risk |
| Low-volatility stock | Lower measured price variability under a method | Stable earnings or immunity from sudden losses |
| Blue chip | Reputation, scale, and operating history | A specific cycle sensitivity or fair price |
A regulated utility may be described as defensive and income-oriented while remaining highly sensitive to interest rates, regulation, capital spending, and leverage. A consumer-products company may have recurring demand but become less defensive after an expensive acquisition. Labels must be updated when the facts change.
Measuring Defensiveness
Revenue and earnings sensitivity
Compare organic revenue, volume, price, gross margin, and operating profit across slowdowns and recoveries. Segment data can reveal that a diversified company combines defensive and cyclical businesses.
Operating leverage
High fixed costs can cause a modest revenue decline to produce a larger earnings decline. Demand stability matters, but so does the cost structure needed to serve that demand.
Beta
Beta measures historical co-movement between a security and a benchmark:
A beta below one is sometimes used as evidence of defensiveness, but the result depends on the benchmark, return interval, estimation period, and market regime. Beta measures historical price behavior, not whether customer demand is essential.
Drawdowns and downside capture
Review the depth and duration of losses during relevant stress periods. A stock can have a low average beta yet suffer a large company-specific decline. Downside statistics should be interpreted with business and valuation evidence rather than used alone.
Worked Example: Defensive Does Not Mean Positive Return
Assume a stock begins the year at $50, pays $2 in dividends, and ends at $44 during a broad market decline:
If the broad market fell 18%, the stock may have provided relative downside resilience while still losing money. Calling the result defensive describes a comparison, not capital preservation.
Why Defensive Stocks Can Become Expensive
When investors value predictable earnings or dividends highly, they may bid defensive stocks to elevated valuation multiples. The business can then meet its operating expectations while the stock underperforms because the valuation falls.
Analysts should test:
- normalized earnings and free cash flow rather than one unusually strong year;
- interest-rate and discount-rate sensitivity;
- how much growth is embedded in the current multiple;
- dividend coverage after required capital spending;
- regulatory or reimbursement scenarios; and
- terminal value assumptions in a discounted cash-flow model.
Perceived stability can reduce business uncertainty without eliminating valuation risk.
Risks and Limitations
- Valuation risk: demand for stability can make a defensive stock expensive.
- Interest-rate sensitivity: dividend-oriented or long-duration businesses can reprice when discount rates change.
- Regulatory risk: allowed returns, prices, reimbursement, or operating requirements can change.
- Input-cost risk: commodity, labor, transport, and financing costs can pressure margins.
- Leverage risk: debt and fixed obligations can offset stable revenue.
- Disruption risk: customer habits, technology, private labels, or new distribution channels can weaken an established business.
- Dividend risk: dividends are not guaranteed and can be reduced when cash needs rise.
- Company-specific risk: recalls, litigation, fraud, outages, or poor acquisitions can dominate sector defensiveness.
- Model risk: historical beta, correlation, and downside measures may not persist.
- Concentration risk: several defensive holdings can share the same rate, regulation, or valuation exposure.
- Inflation risk: stable nominal revenue may not preserve real purchasing power or margins.
How to Evaluate a Defensive Stock
- Define the comparison. State the benchmark, peers, economic variable, and period behind the label.
- Analyze demand. Review volumes, customer retention, price elasticity, contracts, and recurring purchases.
- Study full-cycle results. Compare revenue, margins, cash flow, and working capital across expansions and slowdowns.
- Measure operating leverage. Separate fixed and variable costs and estimate break-even revenue.
- Stress the balance sheet. Examine debt maturities, interest coverage, pensions, leases, and capital requirements.
- Check regulation and pricing. Identify who controls prices and how quickly costs can be passed through.
- Review market behavior. Calculate beta and drawdowns using an appropriate benchmark and more than one period.
- Test valuation. Model slower growth, lower margins, dividend reductions, and higher discount rates.
- Inspect portfolio overlap. Look through funds for repeated sector, issuer, rate, and factor exposure.
- Read current filings. Verify segment economics, risks, commitments, and legal matters from primary disclosures.
Common Mistakes
- Treating defensive as a synonym for safe or principal-protected.
- Assuming every company in a defensive sector has stable earnings.
- Using low historical beta as the only evidence.
- Confusing a high dividend yield with business resilience.
- Ignoring leverage, regulation, input costs, and capital spending.
- Paying any valuation for perceived stability.
- Expecting a defensive stock to rise whenever the broad market falls.
- Counting several similar defensive funds as independent diversification.
Authoritative Sources
- Sector-classification principles and consumer-staples description: S&P Dow Jones Indices GICS overview.
- Stock, business, market, liquidity, and concentration risk: FINRA risk guide.
- Volatility and beta context: FINRA volatility guide.
- Diversification limitations: FINRA asset-allocation and diversification guide.
- Public-company filings: SEC EDGAR search.
Related Terms
- Cyclical Stock: A stock whose business is more sensitive to economic activity.
- Income Stock: A stock held partly for recurring dividends.
- Value Stock: A stock considered inexpensive relative to selected fundamentals.
- Blue Chip: An informal reputation-based label for an established company.
- Beta: A measure of historical sensitivity to benchmark returns.
- Business Cycle: Fluctuations in aggregate economic activity over time.
- Operating Leverage: The sensitivity of operating profit to revenue changes caused by fixed costs.
FAQs
Can a defensive stock lose money in a recession?
Are all utility, health-care, or consumer-staples stocks defensive?
Is a low-beta stock automatically defensive?
This article is educational and does not provide investment recommendations or individualized financial advice. Company facts, classifications, estimates, and market conditions can change.