CAPM
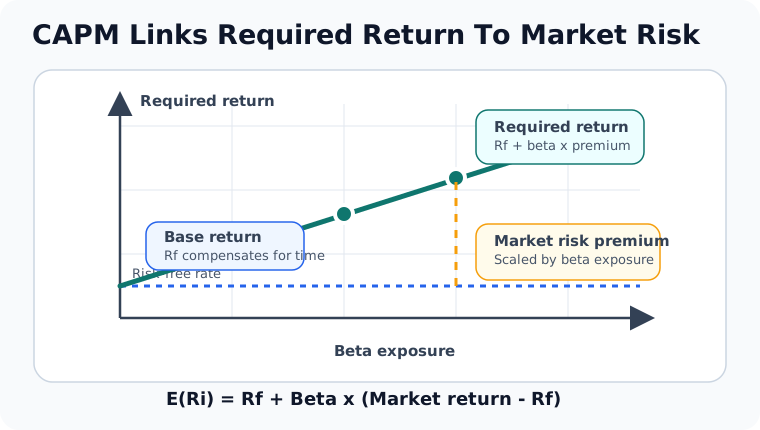
CAPM links an asset's expected return to a risk-free rate, market risk premium, and beta exposure to systematic market risk.
The Capital Asset Pricing Model (CAPM) is a single-factor equilibrium model that links an asset’s expected return to its beta exposure to the market portfolio. Under the model, investors are compensated for systematic market risk, while asset-specific risk can be diversified and does not earn a separate expected premium.
Key Takeaways
- CAPM estimates a required or expected return from the risk-free rate, market risk premium, and asset beta.
- Beta measures covariance with the selected market portfolio, not every form of risk or total volatility.
- The model concerns expected returns; it does not predict the return that will occur in one period.
- The theoretical market portfolio includes all investable risky assets, while practical applications use an imperfect proxy.
- Risk-free rate, beta, market-premium estimate, horizon, and currency must be internally consistent.
- CAPM is useful as a transparent benchmark, but empirical evidence does not support treating it as a complete description of returns.
- A model-implied return is not a recommendation, guaranteed return, or proof that a security is fairly valued.
CAPM Formula
where:
E(R_i)is the expected or required return on assetiR_fis the risk-free rate for the relevant horizon and currencybeta_iis the asset’s sensitivity to market excess returnE(R_m)is the expected return on the market portfolioE(R_m)-R_fis the expected market risk premium
Beta can be written as:
The numerator measures how the asset and market move together. An asset can have substantial standalone volatility but a modest beta if much of its variation is unrelated to the selected market.
Worked Example
Assume:
- risk-free rate:
3% - expected market return:
8% - asset beta:
1.20
The expected market risk premium is 8% - 3% = 5%. CAPM gives:
The 9.0% result is a model-implied expected return. It is not a promise that the asset will earn 9.0%.
If an analyst instead uses a 4% risk-free rate while retaining a 5% market premium, the estimate becomes:
4% + 1.20 x 5% = 10%
If beta is re-estimated at 0.90 with the original 3% rate and 5% premium, the estimate becomes:
3% + 0.90 x 5% = 7.5%
Small input changes can materially alter a valuation discount rate.
Interpreting Beta
| Beta | CAPM interpretation | What it does not establish |
|---|---|---|
1.0 | Same modeled market sensitivity as the market portfolio | Same total volatility or identical returns |
Above 1.0 | Greater sensitivity to the chosen market factor | Greater risk under every scenario |
Between 0 and 1.0 | Positive but lower market sensitivity | Safety or low total risk |
0 | No estimated linear market sensitivity | No risk, no loss, or no other factor exposure |
Below 0 | Tends to move opposite the market factor in the estimate | A reliable hedge in every future period |
Beta depends on the benchmark, return frequency, lookback period, currency, corporate events, and estimation method. A historical beta can change and is measured with error.
FINRA’s beta overview describes beta as movement relative to a benchmark assigned a beta of one. CAPM uses that market sensitivity as a priced risk exposure, but practical estimates should not be confused with a stable physical property.
Systematic Versus Asset-Specific Risk
CAPM separates:
- systematic risk: covariance with the broad market, represented by beta
- asset-specific risk: residual variation not explained by the market factor
In the model, a well-diversified investor can reduce asset-specific risk by combining securities. Because the market does not need to compensate investors for risk that can be diversified without sacrificing expected return, only systematic beta risk earns the CAPM premium.
Real portfolios can retain sector, country, credit, duration, liquidity, volatility, and factor exposures that a single market beta does not capture.
The Security Market Line
The Security Market Line graphs CAPM expected return on the vertical axis and beta on the horizontal axis.
- intercept: risk-free rate
- slope: expected market risk premium
- market point: beta
1and expected market return
The SML applies to individual assets and portfolios in the model. A gap between an analyst’s expected return and the SML return is a model-relative alpha estimate, not definitive proof of mispricing.
The Capital Market Line
The Capital Market Line uses total portfolio volatility, not beta. It describes efficient combinations of the risk-free asset and market portfolio under stronger assumptions.
| Feature | Security Market Line | Capital Market Line |
|---|---|---|
| Horizontal axis | Beta | Standard deviation |
| Applies to | Individual assets and portfolios | Efficient risk-free/market combinations |
| Risk concept | Systematic market exposure | Total portfolio volatility |
| Equation | CAPM expected return | Risk-free rate plus market Sharpe slope |
Using an individual stock’s standard deviation on the CML is a category error.
Main Assumptions
Textbook CAPM versions generally rely on assumptions such as:
- investors choose portfolios using expected return and variance over a common period
- investors have homogeneous expectations
- markets are competitive and securities are divisible
- taxes, transaction costs, and trading restrictions are absent or irrelevant
- investors can lend and borrow at the same risk-free rate
- all relevant assets are tradable and included in the market portfolio
- investors can diversify asset-specific risk
These assumptions make the model tractable. They do not describe every institution, household, private asset, tax regime, borrowing constraint, or market friction.
William Sharpe described the original CAPM as having many simplifying assumptions, noting that simplicity is both a strength and a weakness.
Practical Uses
Cost of Equity
Valuation and corporate-finance models often use CAPM to estimate a cost of equity. Analysts should align the risk-free rate and market premium, use a beta appropriate to the business and capital structure, and test sensitivity.
Performance Evaluation
Realized return can be compared with a CAPM-implied return to estimate Jensen-style alpha. The result remains conditional on the benchmark, beta estimate, period, and single-factor model.
Portfolio Analysis
Beta helps estimate how much market exposure a position contributes to a diversified portfolio. It should be combined with total risk, concentration, liquidity, and scenario analysis.
Hurdle Rates
A CAPM estimate can inform a required return for a project or security whose systematic risk is comparable to the beta input. It should not be applied mechanically to cash flows with different currency, duration, leverage, or business risk.
Estimating CAPM Inputs
Risk-Free Rate
Match currency, horizon, nominal or real treatment, and valuation date. Government securities can serve as practical inputs but still carry interest-rate, inflation, and reinvestment risk.
Market Risk Premium
The premium may be estimated from historical returns, surveys, implied cash-flow models, or economic models. Each method produces uncertainty and can vary over time.
Beta
Document:
- market proxy
- return frequency
- estimation window
- use of excess or total returns
- treatment of outliers
- raw versus adjusted beta
- leverage and capital-structure changes
For private companies or projects, analysts may use comparable-company unlevered betas and then apply a target capital structure. That process adds selection and measurement risk.
Model Tests and Limitations
CAPM remains influential because it gives a clear relationship between diversification, covariance, and expected return. It is not a complete empirical model.
Important limitations include:
- the true market portfolio is unobservable
- expected returns and premiums are difficult to estimate
- beta varies with period and benchmark
- borrowing and lending rates differ
- taxes, costs, short-sale constraints, and illiquidity matter
- multiple factors appear related to returns
- investor objectives and liabilities differ
- realized returns are noisy tests of expected-return models
A Federal Reserve paper on robust CAPM discusses empirical weakness in the simple beta/return relationship. A later Federal Reserve study of linear factor models presents beta pricing as a broader model class and emphasizes statistical inference rather than certainty.
Common Mistakes
- Treating CAPM expected return as a forecast or guarantee.
- Calling beta total risk.
- Saying beta above one always means greater total volatility.
- Using a domestic stock index as the complete theoretical market portfolio without qualification.
- Mixing a current risk-free rate with an incompatible historical premium.
- Using equity beta for debt or project cash flows without adjustment.
- Calling every realized return above CAPM manager skill.
- Ignoring fees, leverage, liquidity, taxes, and estimation uncertainty.
- Assuming the model’s simplifying assumptions hold exactly.
Related Terms
- Beta: Estimated sensitivity to a selected market or factor return.
- Market Risk Premium: Expected market return above the selected risk-free rate.
- Security Market Line: CAPM expected return plotted against beta.
- Capital Market Line: Efficient combinations of the risk-free asset and market portfolio plotted against total volatility.
- Alpha: Return or expected-return difference after a stated benchmark or model adjustment.
FAQs
Does CAPM predict an investment's actual return?
Is beta the same as total volatility?
Why is CAPM still used despite its limitations?
Educational Use
This article provides general financial education. CAPM estimates depend on uncertain assumptions and inputs and are not personalized investment, valuation, tax, legal, or fiduciary advice.