Sharpe Ratio
Risk-adjusted performance ratio comparing average excess return with the total volatility of a portfolio or strategy.
The Sharpe Ratio measures average return above a chosen reference rate per unit of total return volatility. Analysts use it to compare how efficiently portfolios or strategies compensated investors for the variability of their returns, but only when the inputs cover comparable periods and use consistent methods.
Key Takeaways
- The numerator is average excess return; the denominator is the standard deviation of returns.
- Returns, the reference rate, and volatility must use the same frequency and measurement period.
- A higher ratio can indicate better historical risk-adjusted performance, but it does not prove that a strategy is safer or will perform well in the future.
- Sharpe treats favorable and unfavorable volatility alike, so it can miss skew, tail losses, illiquidity, and stale pricing.
Formula
For a series of periodic returns, a common historical form is:
Where:
- (R_p) is the portfolio return for each period
- (R_f) is the matching risk-free rate or other stated reference return
- (\overline{R_p-R_f}) is average periodic excess return
- (s(R_p-R_f)) is the historical standard deviation of periodic excess returns
If the reference return is constant within the sample, the standard deviation of excess returns equals the standard deviation of portfolio returns. If it varies, calculate the excess-return series before estimating its standard deviation.
Worked Example
Assume a portfolio produced an average monthly return of 0.8%. The matching monthly risk-free rate averaged 0.2%, and the monthly standard deviation of excess returns was 2.5%.
The portfolio earned 0.24 units of average monthly excess return per unit of monthly volatility. The ratio is not a 24% investment return.
Under the simplifying assumption that monthly excess returns are independent and similarly distributed, an approximate annualized ratio is:
That square-root-of-time conversion can be misleading when returns are autocorrelated, volatility changes over time, or valuations are smoothed. A calculation should disclose the data frequency, sample period, reference rate, fee treatment, and annualization method.
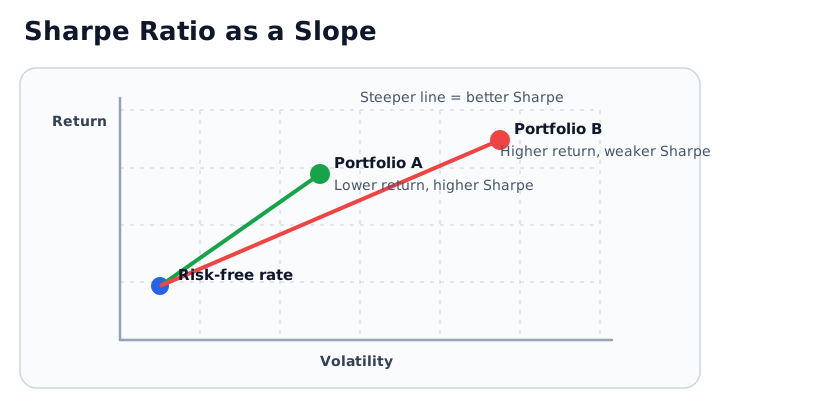
When two portfolios use the same reference rate and comparable risk assumptions, the steeper line represents more expected excess return per unit of volatility.
How to Interpret the Sharpe Ratio
A positive ratio means average portfolio return exceeded the stated reference rate during the measurement period. A zero ratio means no average excess return, and a negative ratio means the portfolio underperformed that reference rate.
There is no universal value that makes a Sharpe Ratio “good.” A useful comparison requires:
- similar investment objectives and opportunity sets
- the same observation frequency and evaluation window
- the same reference-rate convention
- consistent gross-of-fee or net-of-fee returns
- enough observations to make the estimate meaningful
Comparing a short-volatility strategy with a broad equity fund, for example, may produce a numerical ranking without answering a useful investment question. Historical ratios are estimates from one realized path, not forecasts or guarantees.
Sharpe, Sortino, and Treynor Compared
| Ratio | Return numerator | Risk denominator | Most useful when | Main limitation |
|---|---|---|---|---|
| Sharpe | Average return minus reference rate | Total standard deviation | Total return variability is relevant | Penalizes upside and downside volatility equally |
| Sortino | Average return minus target return | Downside deviation below that target | Failure to meet a target is the main concern | Depends heavily on the target and deviation convention |
| Treynor | Average return minus risk-free rate | Portfolio beta | Comparing well-diversified portfolios against the same market benchmark | Ignores idiosyncratic risk and depends on estimated beta |
Risks and Limitations
Volatility is not the same as loss
Standard deviation records variation in both directions. Two portfolios can have the same Sharpe Ratio but very different drawdowns, liquidity, leverage, concentration, or exposure to rare losses.
Smoothed returns can inflate the ratio
Infrequent appraisals, stale prices, or model-based valuations can suppress measured volatility. The resulting ratio may look stronger even though the economic risk has not disappeared.
Results are sample-dependent
Changing the start date, observation frequency, reference rate, or fee basis can change the result. A ratio based on a short favorable period should not be treated as stable evidence.
Correlation still matters
A portfolio with a lower standalone Sharpe Ratio may improve a broader portfolio if its returns diversify other holdings. The ratio does not incorporate how adding the asset changes whole-portfolio correlation.
Practical Review Checklist
Before comparing reported Sharpe Ratios, verify:
- whether returns are historical or forecast
- whether returns are gross or net of fees and trading costs
- which reference rate was used and whether its maturity matches the return interval
- whether arithmetic excess returns and standard deviation use the same observations
- how the ratio was annualized
- whether illiquid holdings or smoothing may understate volatility
- whether drawdown, tail loss, leverage, and correlation measures tell a different story
Knowledge Check
Related Terms
- Risk-Free Rate: Supplies the reference return for the excess-return calculation.
- Standard Deviation: Measures the total return variability in the denominator.
- Sortino Ratio: Replaces total volatility with downside deviation below a target.
- Treynor Ratio: Uses benchmark beta as the risk denominator.
- Information Ratio: Compares benchmark-relative return with tracking error rather than a risk-free baseline.
Sources
- William F. Sharpe, “The Sharpe Ratio” (Stanford University)
- CFA Institute Research and Policy Center: Risk-Adjusted Performance Measures
FAQs
Is a higher Sharpe Ratio always better?
Can the Sharpe Ratio be negative?
Does a high Sharpe Ratio predict future returns?
This page is for financial education. It does not recommend a portfolio, fund, strategy, or risk level.