Risk-Return Tradeoff
The risk-return tradeoff compares the expected compensation from an investment or portfolio with the uncertainty and loss it requires accepting.
The risk-return tradeoff is the relationship between the expected compensation from an investment or portfolio and the uncertainty or potential loss accepted to pursue it. Higher potential return generally requires bearing greater risk, but taking greater risk does not guarantee a higher realized return.
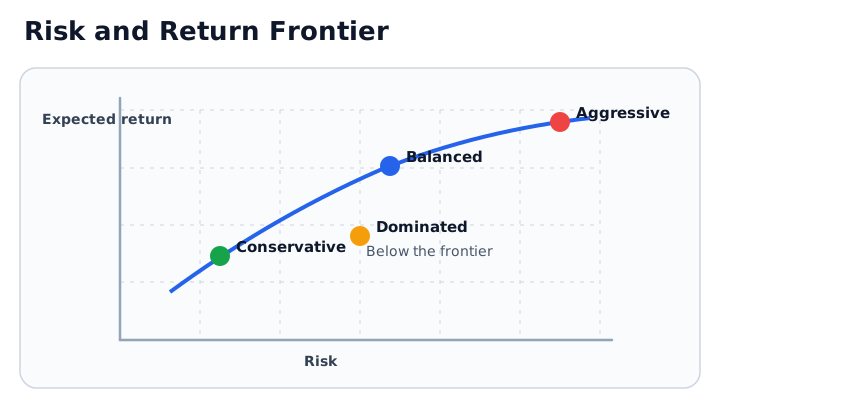
A risky asset needs a plausible expected benefit to be attractive, but the benefit remains uncertain. A portfolio below the frontier is inefficient only under the model, inputs, and risk measure used.
Key Takeaways
- The tradeoff concerns expected or potential return, not a promise about the realized outcome.
- Risk has multiple dimensions, including loss severity, volatility, default, illiquidity, concentration, leverage, inflation, and shortfall.
- More risk is not automatically better; some risks are uncompensated, avoidable, or poorly measured.
- Portfolio risk depends on weights, correlations, and behavior during stress, not just the risk of each holding viewed separately.
- A high expected return can reflect a low price, severe uncertainty, leverage, or risk of permanent loss.
- Risk-adjusted ratios help comparison but cannot capture every objective or tail event.
- The relevant portfolio must fit the investor’s horizon, liquidity needs, liabilities, and ability and willingness to bear loss.
Why the Tradeoff Exists
Investors commit capital today for uncertain future cash flows. If two opportunities have comparable expected cash flows but one has a greater chance of an adverse outcome, investors generally require a lower purchase price, higher expected return, stronger protection, or another benefit to bear the added risk.
That compensation can appear as:
- a higher expected return
- a lower valuation or purchase price
- a wider credit or liquidity spread
- stronger covenants or collateral
- contractual seniority
- optionality or other downside protection
The tradeoff does not imply that every risk earns compensation. Operational mistakes, avoidable concentration, excessive fees, fraud, and buying an overpriced asset can add risk without improving expected return.
Investor.gov summarizes the principle in its risk-and-reward guidance: investments with greater risk may offer higher potential returns but also expose investors to greater losses.
Expected Return Is Not Realized Return
Suppose Asset A has an estimated expected return of 5% and Asset B has an estimated expected return of 8%. Asset B’s higher estimate does not mean it will earn exactly 8% or outperform Asset A during the next year.
Possible realized outcomes include:
- Asset B earns more than
8% - Asset B earns less than Asset A
- both assets lose money
- the original estimates change as prices and information change
Expected return is a probability-weighted forecast. Realized return is one outcome from the distribution. Confusing the two turns an uncertain estimate into a false promise.
Worked Example: Comparing Three Portfolios
Assume an analyst uses the following hypothetical one-year estimates:
| Portfolio | Expected return | Estimated volatility | Expected return above 2% baseline |
|---|---|---|---|
| A | 4.0% | 5.0% | 2.0% |
| B | 7.0% | 10.0% | 5.0% |
| C | 7.0% | 16.0% | 5.0% |
A simple expected excess-return-to-volatility ratio is:
Using the estimates:
- Portfolio A:
(4% - 2%) / 5% = 0.40 - Portfolio B:
(7% - 2%) / 10% = 0.50 - Portfolio C:
(7% - 2%) / 16% = 0.3125
Portfolio B has higher estimated return than A and a higher expected excess return per unit of volatility under these inputs. Portfolio C has the same estimated return as B but greater estimated volatility, so C appears dominated if volatility is the only risk measure and all other attributes are equal.
That conclusion is conditional. C might have different liquidity, inflation sensitivity, tax treatment, drawdown shape, or performance in a liability stress. Estimates can also be wrong. The ratio narrows the comparison; it does not decide which portfolio is appropriate.
Portfolio Risk Depends on Correlation
The volatility of a two-asset portfolio is:
where w represents weights, sigma represents asset volatility, and rho represents correlation.
An asset with high standalone volatility can still improve a portfolio if its return pattern offsets other holdings. Conversely, two individually moderate-risk assets can create a concentrated portfolio if they respond to the same economic shock.
Correlation is not constant. Diversification benefits can weaken during stress, so portfolio analysis should include scenarios and concentration limits rather than relying on one historical estimate.
Different Meanings of Risk
| Risk measure | What it captures | What it can miss |
|---|---|---|
| Volatility | Dispersion of returns around an average | Direction of movement and permanent loss |
| Drawdown | Decline from a prior peak | Loss before the observed peak or future recovery time |
| Downside deviation | Returns below a target or threshold | Tail shape above and below the threshold |
| Value at risk | Estimated loss threshold at a confidence level | Loss severity beyond the threshold |
| Default probability | Chance an issuer fails to meet obligations | Recovery amount, liquidity, and mark-to-market loss |
| Duration | Sensitivity to interest-rate changes | Credit, option, inflation, and liquidity risk |
| Tracking error | Variability relative to a benchmark | Absolute loss and benchmark suitability |
| Shortfall probability | Chance wealth misses a goal or liability | Severity and timing of the shortfall |
The best measure depends on the decision. A retiree funding withdrawals, a bank managing capital, and an analyst comparing equity funds can all mean different things by risk.
Risk Premium and Required Return
One simplified required-return relationship is:
If perceived risk rises and expected cash flows do not change, investors may require a larger Risk Premium. That raises the discount rate and generally lowers present value.
The premium is not directly observable and may vary over time. A price decline can raise expected return, but it can also signal weaker expected cash flows or a more severe risk than previously understood.
Efficient and Inefficient Choices
Under mean-variance analysis, an efficient portfolio offers:
- the highest expected return for a stated volatility, or
- the lowest volatility for a stated expected return
A portfolio is dominated if another candidate offers higher expected return with no more modeled risk, or lower modeled risk with no less expected return.
The Efficient Frontier depends on estimated returns, volatilities, correlations, constraints, and the selected risk definition. Estimation error, transaction costs, taxes, illiquidity, and non-normal losses can change the practical result.
How Investors and Analysts Use the Tradeoff
Asset Allocation
Portfolio designers compare how changes in equity, fixed income, cash, real assets, or diversifiers affect expected return and multiple forms of risk.
Security Selection
Analysts compare expected cash flows and valuation with credit, business, liquidity, governance, and downside risks. A compelling company is not automatically a compelling security at every price.
Capital Budgeting
Businesses use required returns to evaluate uncertain project cash flows. The risk adjustment should reflect the project rather than mechanically applying one company-wide hurdle rate.
Performance Evaluation
Raw return is compared with benchmark risk, volatility, drawdown, leverage, and costs. A higher return produced by materially higher exposure is not necessarily superior risk-adjusted performance.
A Practical Evaluation Framework
For an investment or portfolio, document:
- expected return and how it was estimated
- baseline or benchmark
- principal risk measures
- plausible loss in normal and stressed conditions
- concentration and correlation with existing exposures
- liquidity and expected holding period
- leverage, collateral, and financing
- fees, transaction costs, and taxes
- objective, liability, and withdrawal needs
- assumptions that would change the decision
The analysis should show both percentage and dollar outcomes where possible.
Risks and Limitations
- Estimation error: expected return, volatility, and correlation are uncertain.
- Tail risk: standard deviation may understate rare or discontinuous losses.
- Liquidity risk: an asset may be difficult to sell when loss capacity is lowest.
- Leverage: borrowing magnifies gains, losses, and forced-liquidation risk.
- Horizon mismatch: a long-run expectation may not help when funds are needed soon.
- Benchmark error: a favorable comparison may use an irrelevant risk baseline.
- Behavior risk: an investor may abandon the plan after losses.
- Model dependence: an efficient choice under one model can be poor under another.
Common Mistakes
- Assuming higher risk guarantees higher return.
- Chasing recent performance without identifying the exposure that produced it.
- Treating volatility as the only form of risk.
- Ignoring permanent loss, drawdown duration, illiquidity, and leverage.
- Comparing returns without a common period or benchmark.
- Assuming diversification removes all loss.
- Selecting the highest modeled return without testing investor constraints.
- Treating a precise forecast as a contractual outcome.
Authoritative Context
- Investor.gov: Five Questions to Ask Before You Invest
- Investor.gov: Asset Allocation and Diversification
- FINRA: Know Your Risk Tolerance
Related Terms
- Expected Return: A probability-weighted estimate of future return rather than a guaranteed outcome.
- Risk Premium: Expected compensation above a defined lower-risk baseline.
- Risk Tolerance: Willingness and financial ability to accept uncertainty and loss for a specific goal.
- Standard Deviation: A measure of return dispersion used in many portfolio models.
- Diversification: Combining exposures to reduce concentration without eliminating systematic risk.
FAQs
Does higher risk always produce a higher return?
Can diversification improve the risk-return tradeoff?
Is the portfolio with the highest expected return the best choice?
Educational Use
This article provides general financial education. Hypothetical estimates are not forecasts or guarantees, and the article is not personalized investment, portfolio, valuation, tax, legal, or fiduciary advice.