Roll-Down Return
Roll-down return estimates the bond price effect of aging to a shorter curve point under an unchanged-curve assumption.
Roll-down return is the estimated bond price effect of aging to a shorter maturity point and being repriced on an assumed unchanged yield or spread curve. On an upward-sloping curve, a bond may roll toward a lower-yield point, creating a price tailwind; on a flat or inverted curve, that effect may be small or negative.
Roll-down is a scenario estimate, not a guaranteed return. The curve can shift or twist, credit spreads can change, and the bond’s cash flows or liquidity can differ from the model.
Key Takeaways
- Roll-down isolates or estimates the effect of moving along a curve as time passes.
- A positive estimate usually requires a favorable curve slope for the bond’s remaining maturity and cash-flow profile.
- “Unchanged curve” means today’s curve is reused at the shorter horizon maturity; it does not mean the bond keeps today’s starting yield.
- Desk conventions differ: broad roll-down price return can include pull to par, while a narrower attribution removes the constant-yield time effect.
- Coupon carry, financing cost, pull to par, benchmark roll, credit-spread roll, and actual market movement should be labeled separately.
- Duration provides an approximation, but exact cash-flow repricing is preferable.
- Callable, prepayable, amortizing, floating-rate, and credit-sensitive bonds require more than a simple maturity-yield comparison.
Core Idea
Suppose today’s 10-year yield is 4.50% and today’s 9-year yield is 4.20%. One year from now, a 10-year bond will have about nine years remaining. Under an unchanged-curve scenario, the bond is repriced using the current 9-year curve point rather than the original 10-year yield.
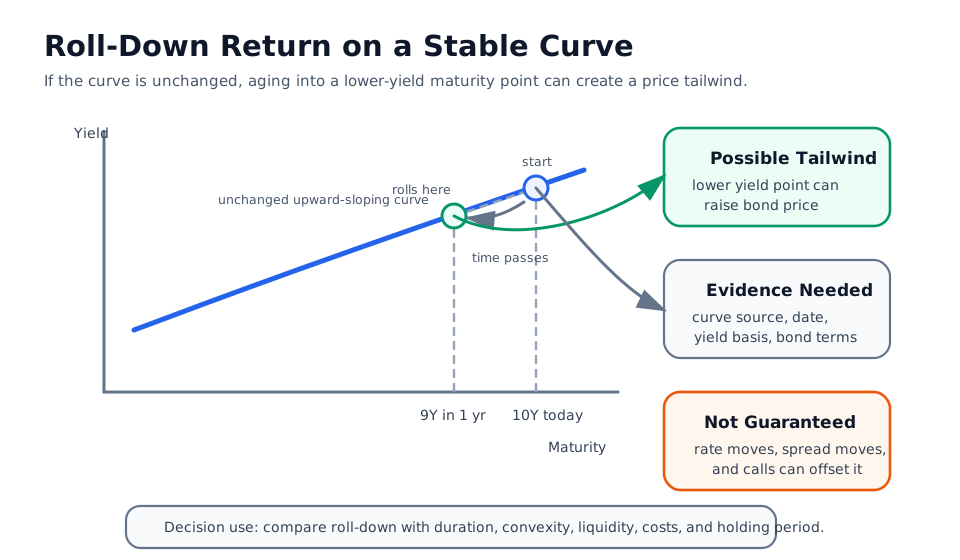
If the bond’s yield falls from 4.50% to 4.20% solely because it moves along the unchanged curve, its price rises, all else equal. The assumption is demanding: after one year, the 9-year point must equal today’s 9-year point, and the bond’s spread, liquidity, and expected cash flows must also follow the modeled path.
Basic Calculation
Let:
P0be today’s bond price;hbe the holding period;P_h,curvebe the horizon price of the remaining cash flows using today’s curve at the shorter maturity; andCF_hbe coupon or principal cash received during the holding period.
A broad roll-down price-return estimate is:
The unchanged-curve holding-period return before financing, taxes, fees, and currency effects is:
Some analysts isolate the curve-roll effect by comparing P_h,curve with a horizon price that uses the original starting yield, P_h,same yield:
The difference between the broad and isolated measures is mainly the time or pull-to-par effect under this simple example. A report should state which convention it uses.
Worked One-Year Example
Assume a noncallable bond is purchased immediately after a coupon payment with:
$1,000face value;- 10 years to maturity;
- a 4% annual coupon paid once per year for simplicity;
- a starting 10-year yield of 4.50%; and
- a current 9-year curve yield of 4.20%.
The starting price at a 4.50% yield is $960.44.
Step 1: Constant-yield horizon price
After one year and immediately after receiving the $40 coupon, the bond has nine years remaining. If it still yields 4.50%, its price is $963.66.
1Constant-yield price change = $963.66 - $960.44 = $3.22
2Constant-yield price return = $3.22 / $960.44 = 0.34%
This increase is primarily the discount bond’s pull toward par as maturity approaches. It is not the isolated curve-roll benefit.
Step 2: Unchanged-curve horizon price
If the unchanged curve assigns 4.20% to a nine-year bond at the horizon, the remaining cash flows are worth $985.26.
1Broad roll-down price change = $985.26 - $960.44 = $24.82
2Broad roll-down price return = $24.82 / $960.44 = 2.59%
Step 3: Isolate the curve-roll effect
1Isolated curve-roll effect = $985.26 - $963.66 = $21.60
2Isolated curve-roll return = $21.60 / $960.44 = 2.25%
Step 4: Add coupon income
1Coupon return = $40.00 / $960.44 = 4.16%
2Unchanged-curve HPR = ($40.00 + $985.26 - $960.44) / $960.44
3                    = 6.75%
The 6.75% estimate combines coupon income and broad price change. It excludes financing, bid-ask cost, taxes, currency effects, and any actual change in the curve or bond spread.
Why Attribution Conventions Differ
Fixed-income desks use terms such as carry, roll, pull to par, and rolldown with different boundaries.
| Component | One common interpretation |
|---|---|
| Coupon income | Contractual interest accrued or received during the holding period |
| Financing carry | Income less repo or other funding cost, with desk-specific adjustments |
| Pull to par | Price effect from time passing at an unchanged yield for a premium or discount bond |
| Curve roll-down | Incremental price effect from repricing at today’s shorter-maturity curve point |
| Spread roll-down | Effect of moving along an issuer or sector spread curve |
| Market move | Effect of actual benchmark-yield or spread changes relative to the scenario |
Some systems combine coupon, financing, pull, and roll into a carry-and-roll estimate. Others report roll-down as the entire horizon price change under an unchanged curve. Neither label is self-explanatory, so the methodology and components should accompany the number.
Duration Approximation
For a modest yield difference, the isolated curve-roll effect can be approximated using modified duration:
If the bond rolls from 4.50% to 4.20%, Delta y is -0.30%, or -0.0030 in decimal form. The negative yield change produces a positive first-order price effect.
Duration is only an approximation. Exact repricing is preferable when the curve move is large, cash flows are irregular, or optionality makes duration unstable.
Which Curve Should Be Used?
Treasury and government bonds
An analyst may use a Treasury par, spot, fitted, or security-specific curve. A published Constant Maturity Treasury point is a par-curve observation, not necessarily the correct discount rate for every cash flow of an actual bond.
Corporate and credit bonds
All-in yield can be decomposed into a benchmark curve and credit spread. Roll-down may come from both:
1All-in yield at horizon
2    = benchmark curve at shorter maturity
3    + credit spread curve at shorter maturity
Assuming an unchanged Treasury curve while ignoring a steep or unstable spread curve can materially misstate expected return.
Swaps and derivatives
The relevant curve may be an overnight-indexed swap curve, a term benchmark curve, or multiple curves for discounting and projection. The curve must match the instrument and valuation framework.
Inflation-linked and foreign-currency bonds
Real-yield curves, indexation lags, inflation accrual, currency hedging, and cross-currency basis can affect the result. A nominal Treasury curve is not a sufficient input.
Curve Shape and Typical Direction
| Curve shape over the relevant segment | Possible roll effect | Main caution |
|---|---|---|
| Upward sloping | Often positive as the bond rolls to a lower yield | The curve may shift or steepen further |
| Flat | Usually small | Spread or financing changes can dominate |
| Inverted | Can be negative as the bond rolls to a higher yield | Inversion may change before the horizon |
| Humped | Depends on starting and horizon points | Average slope can hide a local adverse segment |
| Twisting | Unstable across key rates | One parallel-shift assumption is inadequate |
Local slope matters more than a broad label such as “normal curve.” A 10-year bond rolling to nine years depends on that segment, not on the difference between three-month and 30-year yields.
When Simple Roll-Down Fails
Callable bonds
Falling yields can increase call probability and cap price appreciation. The expected horizon cash flows and option-adjusted spread may change as the bond rolls.
Mortgage-backed securities
Prepayment expectations can alter average life, duration, and projected principal. A static maturity roll is not enough.
Amortizing bonds
Principal payments reduce exposure during the holding period. Use the actual projected cash-flow schedule rather than final maturity alone.
Floating-rate notes
Coupon resets and discount-margin conventions drive value. The security does not behave like a fixed-coupon bullet bond rolling down a par curve.
Distressed or illiquid bonds
Recovery expectations, stale prices, dealer marks, and wide bid-ask spreads can overwhelm curve mechanics. An estimated roll based on a smooth benchmark may not be executable.
How To Evaluate a Roll-Down Estimate
- Define the holding period and whether the horizon falls before or after a coupon date.
- Map contractual and expected cash flows, including options and principal payments.
- Identify the benchmark, spread, discount, and projection curves used.
- State the unchanged-curve assumption and the exact future curve point.
- Reprice the remaining cash flows at the horizon rather than relying only on maturity labels.
- Separate coupon, financing, pull to par, benchmark roll, spread roll, and actual market movement.
- Stress parallel shifts, steepening, flattening, twists, spread moves, and liquidity costs.
- Compare the estimated benefit with duration, convexity, credit, optionality, and transaction risk.
Common Mistakes
- Treating roll-down return as guaranteed.
- Assuming “unchanged curve” means the bond retains its starting yield.
- Labeling all pull-to-par price change as isolated curve roll without stating the convention.
- Using a par-curve maturity point as if it were a complete spot curve.
- Ignoring credit-spread roll for corporate bonds.
- Measuring slope across unrelated maturities rather than the bond’s local path.
- Omitting coupon timing, accrued interest, financing, and bid-ask costs.
- Applying a bullet-bond calculation to callable, prepayable, or amortizing securities.
- Using modified duration without checking convexity or cash-flow changes.
Public Verification Sources
- U.S. Treasury daily par yield curve rates provide official curve observations used for Treasury market context.
- U.S. Treasury yield-curve methodology explains how official par curve inputs are bootstrapped and interpolated.
- U.S. Treasury interest-rate FAQ explains why CMT points may not equal an actual security’s yield and distinguishes par from zero-coupon curves.
- Federal Reserve H.15 Selected Interest Rates provides public Treasury rate series and period averages.
- FINRA’s bond yield and return guide explains price-yield inversion and why realized return can differ from a quoted yield.
These sources provide curve and yield context. A bond-specific roll-down estimate still requires the actual cash flows, current price, curve choice, spread, holding period, and transaction assumptions.
This article provides general financial education, not individualized investment, trading, tax, or accounting advice.
Related Terms
- Duration: First-order estimate of price sensitivity to the yield change implied by rolling along a curve.
- Convexity: Second-order price adjustment for larger yield changes.
- Yield Curve Risk: Risk that maturity points shift unevenly relative to the roll assumption.
- Treasury Yield: Benchmark and curve conventions used in many roll-down estimates.
- Yield Curve Arbitrage: Active relative-value strategy that may use carry-and-roll analysis but adds trade and hedge assumptions.