Stagflation
Stagflation is a sustained combination of high inflation and weak economic activity, often accompanied by elevated unemployment.
Stagflation is a sustained combination of high inflation and weak or stagnant real economic activity, often accompanied by elevated unemployment. It is difficult for households, businesses, investors, and policymakers because purchasing power and cost pressure can worsen while income, output, and employment are growing slowly or falling.
There is no universal inflation rate, growth rate, unemployment rate, or minimum duration that officially defines stagflation. Analysts should identify the country, period, price index, real-activity measure, labor-market evidence, and comparison baseline instead of applying the label from one data release.
Key Takeaways
- Stagflation combines broad inflation with weak real activity; it is not simply high inflation or a recession by itself.
- A negative supply shock can raise prices while reducing output, but persistent stagflation usually reflects interactions among supply constraints, demand, expectations, wages, productivity, and policy.
- High unemployment often accompanies stagflation, but the concept is broader than an inflation-unemployment comparison.
- Monetary policy faces a difficult near-term tradeoff because tighter financial conditions may restrain inflation while further weakening demand and employment.
- Nominal revenue, wages, interest income, or portfolio returns can rise while their inflation-adjusted value falls.
- Companies differ according to pricing power, input intensity, leverage, debt maturity, working-capital needs, and customer sensitivity.
- No asset class or policy response provides guaranteed protection from stagflation.
How to Identify Stagflation
A credible diagnosis uses several indicators over a meaningful period:
| Dimension | Evidence to review | Main caution |
|---|---|---|
| Inflation | Headline and core consumer-price inflation, producer prices, wage measures, and inflation expectations | One commodity or product price is not broad inflation |
| Real activity | Real GDP, real consumption, industrial production, business investment, and an estimated output gap | Quarterly data are revised and may conflict with monthly indicators |
| Labor market | Unemployment, payroll growth, hours worked, vacancies, participation, and real wages | Employment can lag changes in output |
| Productivity and supply | Output per hour, capacity, energy and import costs, supply-chain conditions | Temporary disruption may not produce persistent stagflation |
| Financial conditions | Policy rates, real yields, credit spreads, lending standards, exchange rates, and market liquidity | Tight conditions can be a response to inflation as well as a cause of weaker activity |
In the United States, the Bureau of Labor Statistics CPI overview explains the Consumer Price Index, while the Bureau of Economic Analysis definition of real GDP distinguishes inflation-adjusted production from nominal output. Labor-market interpretation should use measures such as the BLS unemployment-rate concepts alongside employment and participation data.
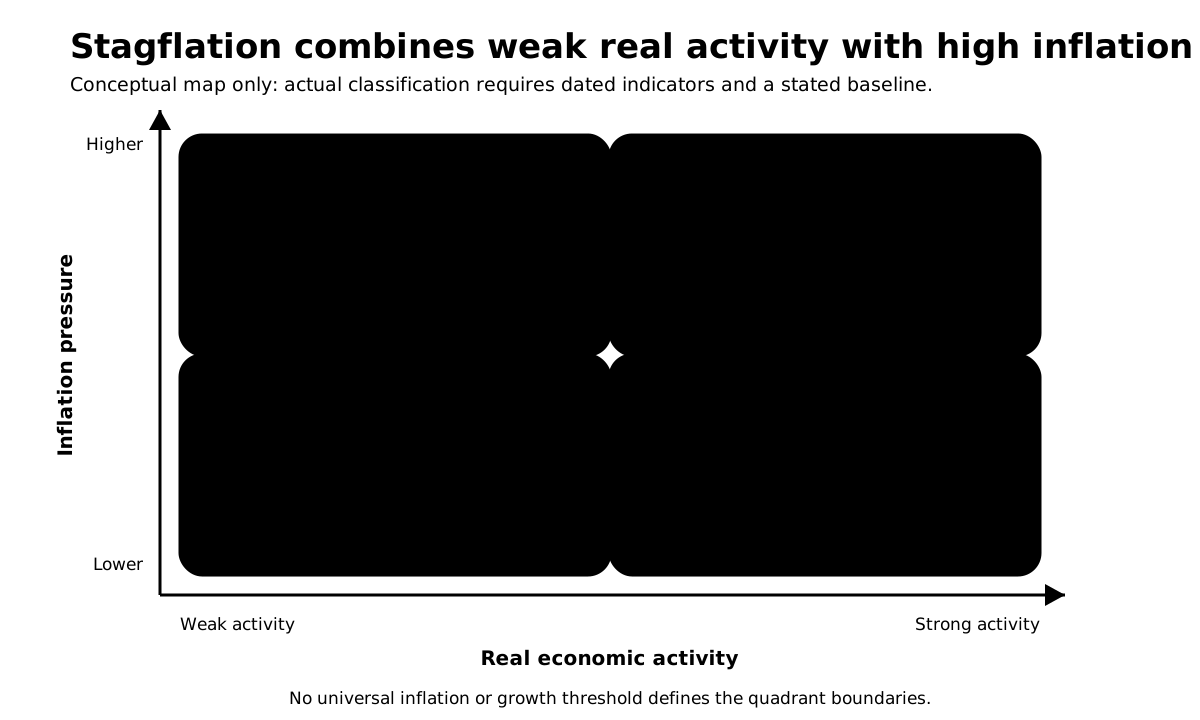
The quadrants organize the concept; they do not create official numerical boundaries. An economy can move between them gradually, and different indicators may give conflicting signals.
Stagflation vs. Other Economic Conditions
| Condition | Inflation | Real activity | Distinguishing feature |
|---|---|---|---|
| Stagflation | High or persistently above the relevant norm | Weak, stagnant, or contracting | Inflation pressure and economic weakness occur together |
| Inflation | General price level is rising | Can be weak or strong | Says nothing by itself about output or employment |
| Recession | Can be high, low, or falling | Broad and significant decline | Describes economic contraction, not a required inflation pattern |
| Disinflation | Inflation remains positive but slows | Can strengthen or weaken | Prices are still rising, but at a slower rate |
| Hyperinflation | Extreme and often accelerating | Usually severely disrupted | Concerns breakdown in money and nominal contracting, not merely weak growth |
| Overheating | High or rising | Strong and above sustainable capacity | Excess demand is more prominent than stagnation |
Stagflation can overlap with a recession, but the terms are not synonyms. An economy can have weak growth without meeting a recession-dating standard, and a recession can occur while inflation is low or falling.
How Stagflation Can Develop
Stagflation rarely has one sufficient cause. Several mechanisms can interact.
Adverse Supply Shocks
A disruption that reduces productive capacity or raises essential input costs can push prices upward while reducing output. Examples include energy shortages, import disruption, crop failures, infrastructure damage, and a sharp decline in productivity.
If energy becomes more expensive, businesses may face higher production and transportation costs. Households also have less income available for other purchases. Output weakens even as the price level rises.
Cost-Push Inflation describes this price-pressure channel, but one cost shock does not automatically create sustained stagflation.
Demand and Policy Interaction
Strong nominal demand can keep inflation broad after an initial supply shock. If monetary or fiscal policy supports spending beyond the economy’s reduced productive capacity, additional demand may raise prices more than real output.
The reverse problem also matters. Tightening policy enough to restrain demand can weaken output and employment before inflation returns to a lower rate. The appropriate response depends on the shock, expectations, financial stability, fiscal conditions, and the institution’s mandate.
Inflation Expectations and Wage-Price Setting
When businesses and households expect inflation to persist, they may adjust prices, wages, contracts, and borrowing decisions. These responses can make inflation more persistent, especially when firms try to preserve margins and workers try to protect real wages.
Expectations are not directly observable. Surveys, market prices, wage agreements, pricing plans, and long-term yields measure different groups and horizons. The IMF discussion of inflation expectations and monetary policy explains why the simple idea of a permanent inflation-unemployment tradeoff failed and why expectations became central to policy analysis.
Weak Productivity and Structural Constraints
Slower productivity growth, labor or capital constraints, declining investment, regulatory bottlenecks, and trade fragmentation can reduce the rate at which the economy can grow without inflation pressure. If estimated potential output is too high, policy may appear less expansionary than it really is.
Currency and Imported Inflation
A depreciating currency raises the domestic price of imported goods and foreign-currency obligations. The effect depends on import intensity, contract currency, hedging, market structure, and how quickly businesses pass costs to customers. Economies dependent on imported food, fuel, or intermediate goods can be especially exposed.
Why the Policy Tradeoff Is Difficult
An adverse supply shock moves inflation and real activity in opposite directions. Policy choices can therefore involve competing near-term effects:
- Tighter monetary policy can restrain demand and reduce the risk that inflation becomes embedded, but higher rates can weaken investment, housing, credit growth, and employment.
- Easier monetary policy can support demand and financial conditions, but may prolong inflation if spending already exceeds reduced supply capacity or expectations are becoming less anchored.
- Broad fiscal support can protect income but may add demand and inflation pressure when it is not matched by supply.
- Targeted fiscal support may cushion the most exposed households or firms with less aggregate demand, but design, financing, timing, and withdrawal still matter.
- Supply-side measures may improve capacity or competition, but infrastructure, labor, energy, and productivity changes often require time.
- Price controls or subsidies can temporarily change measured prices or who pays, but may create fiscal costs, shortages, distorted incentives, or a later price adjustment.
This does not mean policy is powerless. It means the objective, horizon, transmission channels, distributional effects, and financial-stability risks must be stated. An IMF review of monetary policy and commodity-price shocks describes how the response depends on economic slack and policy credibility because tightening affects both inflation and output.
Worked Example: Revenue Growth but Margin Compression
Consider a hypothetical manufacturer with the following income statement:
| Measure | Current year | Stagflation scenario |
|---|---|---|
| Revenue | $100.0 million | $104.0 million |
| Cost of goods sold | $60.0 million | $66.0 million |
| Operating expenses | $25.0 million | $26.5 million |
| Operating profit | $15.0 million | $11.5 million |
| Operating margin | 15.0% | 11.1% |
Revenue rises 4% in nominal terms, but input costs rise 10% and operating expenses rise 6%. Operating profit falls by:
$15.0 million - $11.5 million = $3.5 million
The margin declines to:
$11.5 million / $104.0 million = 11.1%
This illustrates why nominal sales growth can be misleading. The company sells more dollars of output but earns less operating profit because costs rise faster than revenue.
The result is not universal. A company with stronger pricing power, lower energy use, long-term fixed-price supply contracts, or less cyclical demand may perform differently. A complete analysis would also test sales volume, inventories, receivables, wage agreements, interest expense, debt maturities, taxes, and capital spending.
This example is educational and is not a forecast, company valuation, or investment recommendation.
Inflation and Real Investment Returns
Stagflation can reduce the purchasing power of a positive nominal return. The exact real-return relationship is:
Assume an investment earns 4% while the relevant inflation rate is 7%:
The investment gained in nominal dollars but lost about 2.8% of purchasing power before taxes, fees, and cash flows. The relevant inflation measure depends on the investor’s objective and spending pattern; one national price index does not perfectly represent every household or institution.
See Real Return for the calculation and its limitations.
Effects on Financial Decisions
Businesses
Stagflation can compress margins when input, wage, and financing costs rise faster than selling prices. It can also increase working-capital needs because the same physical inventory requires more cash. Companies with weak demand, variable-rate debt, near-term refinancing, and limited pricing power may face several pressures at once.
Analysts should separate price growth from unit volume and compare gross and Operating Margin changes with cash flow and balance-sheet capacity.
Bonds and Credit
Unexpected inflation can reduce the real value of fixed nominal payments and push required yields higher. Rising yields reduce the market value of existing fixed-rate bonds, while weak activity can increase credit risk. Shorter maturity or inflation linkage can reduce some exposure but introduces reinvestment, index-basis, liquidity, and pricing risks.
Equities
Equity effects depend on sector, valuation, leverage, cost structure, and pricing power. Higher discount rates can reduce valuation multiples, while weak real demand and rising costs can pressure earnings. Some businesses may pass through costs or benefit from particular commodity exposures, but no equity sector is a universal stagflation hedge.
Banks and Borrowers
Higher rates may initially increase yields on some assets, but funding costs, credit losses, deposit behavior, collateral values, and loan demand can move adversely. Borrowers face higher debt-service and refinancing costs while real income or cash flow may weaken.
Households
Households can face higher prices, weaker real wage growth, employment risk, and higher borrowing costs at the same time. The effect varies with employment security, debt type, savings, spending mix, housing, and eligibility for indexed income or benefits.
The U.S. Great Inflation as Historical Context
The United States in the 1970s and early 1980s is the standard historical reference, but it should not be reduced to the oil shocks alone. The Federal Reserve History account of the Great Inflation covers excessive monetary expansion, fiscal pressures, the breakdown of Bretton Woods, energy shortages, inaccurate real-time estimates of economic capacity, unstable inflation expectations, and policy choices.
That account dates the Great Inflation from 1965 to 1982. It reports that U.S. inflation rose from a little over 1% in 1964 to more than 14% in 1980, while unemployment was also elevated. Later monetary restraint reduced inflation but involved severe near-term economic costs.
The episode is evidence that supply shocks, demand policy, expectations, data limitations, and credibility can interact. It is not a template proving that every later inflation episode has the same cause or requires the same response.
How to Evaluate a Stagflation Claim
- Define the geography and period. National, regional, and sector conditions may differ.
- Name the inflation measure. Distinguish headline, core, consumer, producer, wage, and expected inflation.
- Use real activity data. Separate nominal spending growth from inflation-adjusted output and volume.
- Review the labor market broadly. Use unemployment, employment, hours, vacancies, participation, and real wages.
- Identify the shock and persistence mechanism. Separate energy, imports, productivity, demand, expectations, and policy effects.
- Check revisions and lags. GDP is revised, inflation components change, and employment may respond later.
- Map financial exposure. Test margins, working capital, debt service, duration, credit, liquidity, and purchasing power.
- Use scenarios, not one forecast. Compare temporary and persistent inflation, weak and severe activity, and alternative policy paths.
Common Mistakes and Limitations
- Using one weak quarter: Stagflation describes a sustained macroeconomic combination, not ordinary data volatility.
- Looking only at nominal GDP or revenue: Price increases can conceal weak real output or falling unit volume.
- Treating high unemployment as mandatory in every definition: Labor markets can lag output, and countries measure slack differently.
- Inventing mild and severe official categories: No standard thresholds create formal stagflation types.
- Saying the Phillips curve simply “breaks”: Supply shocks and changing expectations can shift the short-run relationship; the concept is more nuanced than one stable curve.
- Blaming one commodity shock for everything: Persistence depends on demand, expectations, wages, productivity, policy, and market structure.
- Assuming inflation hedges always work: Asset performance depends on valuation, carry, duration, liquidity, taxes, currency, and the source of inflation.
- Assuming every company can raise prices: Customer demand, competition, contracts, regulation, and input exposure constrain pass-through.
- Comparing countries without matching data: Price indexes, labor definitions, policy regimes, currencies, and import dependence differ.
- Presenting a policy response as costless: Inflation control, income support, and supply measures have timing, distributional, fiscal, and output tradeoffs.
Related Terms
- Inflation: Sustained broad increase in the general price level that reduces money’s purchasing power.
- Economic Growth: Increase in an economy’s inflation-adjusted output, income, or productive capacity over time.
- Recession: Significant and broad decline in economic activity from peak to trough.
- Cost-Push Inflation: Inflation pressure associated with higher production costs or reduced supply.
- Expected Inflation: Anticipated rate of price change reflected in decisions, contracts, surveys, or market prices.
- Consumer Price Index: Price index measuring changes in the cost of a specified consumer basket.
- Unemployment Rate: Share of the labor force without work, available for work, and actively seeking work under the applicable definition.
- Monetary Policy: Central-bank decisions that influence financial conditions, demand, inflation, and economic activity.
- Real Return: Investment return after adjusting for inflation.
FAQs
Is stagflation the same as a recession?
Does one quarter of weak growth and high inflation prove stagflation?
Why is stagflation difficult for monetary policy?
Which investments perform best during stagflation?
This article provides general financial education. It does not forecast inflation or economic growth and does not provide individualized investment, business, tax, legal, or policy advice.