Hammering the Market
Hammering the market is informal language for intensive stock selling by participants expecting lower prices. Learn what it shows and what it cannot prove.
Hammering the market is an informal finance phrase for intensive selling of stocks by speculators or other participants who expect prices to fall or believe current prices are too high. In broader commentary, a stock, sector, or index may be described as “getting hammered” when sustained selling produces a rapid decline.
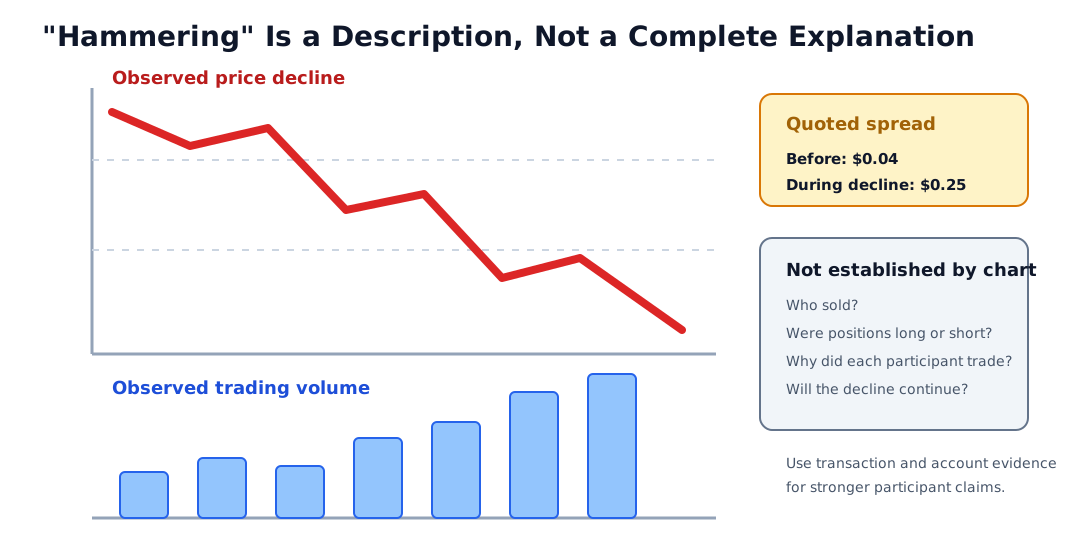
The phrase is descriptive, not a standardized market statistic. Price and volume can document a sell-off, but public data usually cannot prove that every seller was a speculator, believed the asset was overvalued, sold short, or intended to move the market.
Key Takeaways
- Hammering the market refers to heavy selling pressure and a resulting price decline.
- It can involve long-position liquidation, short sales, hedging, dealer activity, forced sales, or several mechanisms at once.
- The term has no universal percentage, volume, or time threshold.
- Heavy selling is not automatically market manipulation or proof of panic.
- Short selling is one possible source of sales, not a required element of the definition.
- A sharp decline can reverse, continue, gap, or become difficult to trade as liquidity changes.
What the Phrase Describes
The established glossary use focuses on intensive selling by participants who expect a decline. In everyday financial reporting, the phrase may be applied after an observable combination such as:
- a large price decline over a short period;
- unusually high sell-side trading activity;
- broad weakness across many stocks or sectors;
- widening bid-ask spreads and reduced displayed depth;
- repeated trades at lower prices; or
- a gap lower after material information.
No single observation is sufficient in every case. A 5% decline can be extraordinary for one instrument and ordinary for another. Volume can be high without one-sided panic, and a wide spread can reflect uncertainty or thin liquidity rather than selling alone.
Worked Example
Assume a fictional stock has:
- prior close: $50.00
- session open after new information: $48.00
- session high: $48.40
- session low: $42.00
- session close: $43.20
- session volume: 12 million shares
- prior 20-session median volume: 2 million shares
- typical quoted spread before the event: $0.04
- observed spread during the decline: as wide as $0.25
The close-to-close return is:
($43.20 - $50.00) / $50.00 x 100 = -13.6%
The intraday range is:
$48.40 - $42.00 = $6.40
The session-volume multiple is:
12 million / 2 million = 6 times the prior median
Those facts support a description of unusually heavy selling and a sharp decline under the chosen benchmarks. They do not identify how much selling came from existing holders, new short positions, options hedging, index activity, margin liquidations, or dealers managing inventory.
They also do not establish that the security was overvalued, that the decline was justified, or that it will continue.
Evidence Ladder
| Evidence | What it can establish | What it usually cannot establish |
|---|---|---|
| OHLC prices | Size and path of the reported price move | Seller identity or motive |
| Trading volume | Quantity completed during the period | Whether each seller was long or short |
| Bid, ask, and depth | Visible liquidity around a timestamp | All hidden or future liquidity |
| Market breadth | How widely declines spread across a selected universe | Common cause of every decline |
| Short-sale records | Transactions marked or reported under applicable rules | Complete economic motive or all related positions |
| Account and order records | Activity of the covered account | Behavior of the whole market |
| News and filings | Information available around the move | Proof that one item caused every trade |
The stronger the claim about who sold and why, the more direct the evidence must be.
Hammering vs. Short Selling
A short sale generally involves selling borrowed or otherwise deliverable stock with the expectation of buying it later. Short selling can contribute to observed sell orders, but hammering can also occur when existing owners liquidate long positions.
Consider an illustrative short sale of 1,000 shares at $100 followed by a purchase to cover at $80:
Gross trading difference = ($100 - $80) x 1,000 = $20,000
That is not net profit. Borrow fees, commissions, distributions owed to the lender, taxes, margin requirements, and execution prices affect the result. If the price rises rather than falls, the short position loses money, and the potential loss is not capped at the original sale proceeds.
Short-interest data also should not be confused with daily short-sale volume. A reported short position can remain open across periods, while transaction data record activity under a different methodology.
Heavy Selling Is Not Automatically Manipulation
Selling because an investor expects a lower price is not, by itself, proof of illegal conduct. The SEC’s investor bulletin notes that investors use short sales to seek profit from declines, hedge other positions, or provide liquidity, while abusive practices intended to manipulate prices can be prohibited.
Legal analysis depends on conduct, intent, evidence, jurisdiction, and the rules in force. A price chart cannot establish those elements. Avoid claims such as “short sellers manipulated the stock” unless reliable regulatory findings or case records support them.
Hammering vs. Similar Terms
| Term | What it describes | Main distinction |
|---|---|---|
| Hammering the market | Informal phrase for intensive selling pressure | Focuses on selling activity and commentary |
| Sell-off | General decline associated with broad selling | More neutral and widely used |
| Wide-Ranging Day | Session with a large high-low span under a benchmark | Can close higher or lower |
| Whipsaw | Move through a rule followed by a rapid reversal | Requires a sequence, not only a decline |
| Market Correction | Decline from a prior market peak under a stated convention | Measures drawdown rather than selling mechanism |
| Bear Market | Sustained, substantial decline under a selected definition | Longer-horizon market state |
| Hammer Candlestick | One-period candle shape with a long lower shadow | Unrelated chart-pattern term despite the similar word |
Liquidity and Execution During Heavy Selling
During a fast decline, displayed bids can execute or disappear, spreads can widen, and new orders can reach lower price levels. The last sale, best bid, and actual execution price can differ.
A stop order may activate during the decline and become a market order under its terms. That prioritizes execution but does not guarantee the stop price. A limit order sets a price boundary but may remain partly or entirely unfilled. An investor should use the broker’s order records and confirmations rather than reconstruct a fill from a chart.
How to Evaluate a “Hammered” Market Claim
- Define the stock, sector, index, venue coverage, session, and timeframe.
- Calculate the price change and high-low range from consistent data.
- Compare volume with a stated historical baseline.
- Review spread, depth, trade size, and volatility around the event.
- Measure breadth if the claim concerns a sector or broad market.
- Separate ordinary sales, short sales, hedges, and forced activity when reliable records permit.
- Identify news and filing timestamps without assuming causation.
- Distinguish legal trading from a supported allegation of manipulation.
- Use execution reports for transaction outcomes.
- State what the available evidence cannot reveal.
Risks and Common Mistakes
- Treating an informal phrase as a precise market classification.
- Assuming every seller is bearish, speculative, or acting on the same information.
- Equating heavy selling with short selling.
- Equating short selling with manipulation.
- Using one price decline without a volatility or volume benchmark.
- Ignoring gaps, halts, auctions, spreads, and disappearing depth.
- Assuming a sharp decline must rebound because it appears excessive.
- Assuming a decline must continue because volume was high.
- Presenting a gross short-sale difference as guaranteed profit.
- Confusing hammering with the hammer candlestick pattern.
Public Source Checks
- Nasdaq Glossary: Hammering the Market records the established market phrase and its association with heavy selling by speculators expecting lower prices.
- Investor.gov: An Introduction to Short Sales explains short-sale mechanics, risks, legitimate purposes, and the distinction between ordinary and abusive activity.
- FINRA: Short Interest, What It Is and Is Not distinguishes short positions from other short-sale data and explains why investors may sell short.
- Investor.gov: Executing an Order explains why displayed prices and actual executions can differ in fast markets.
Related Terms
- Short Selling: Sale mechanics that can express a bearish view or hedge but are not required for heavy selling.
- Market Volatility: Magnitude and frequency of price variation.
- Liquidity: Ability to trade without excessive cost, delay, or price disruption.
- Trading Volume: Completed quantity used to measure activity during the decline.
- Price Gap: Separation between price ranges that can occur after new information.
- Stop Order: Triggered order whose execution can be affected by a fast decline.
FAQs
What does it mean when a stock gets hammered?
Is hammering the market the same as short selling?
Is hammering the market illegal?
Does heavy selling mean a stock will rebound?
Educational Use
This article provides general market education, not personalized investment, trading, tax, or legal advice. It does not recommend selling, shorting, buying a decline, or using a particular order type.