Trading Volume and Open Interest
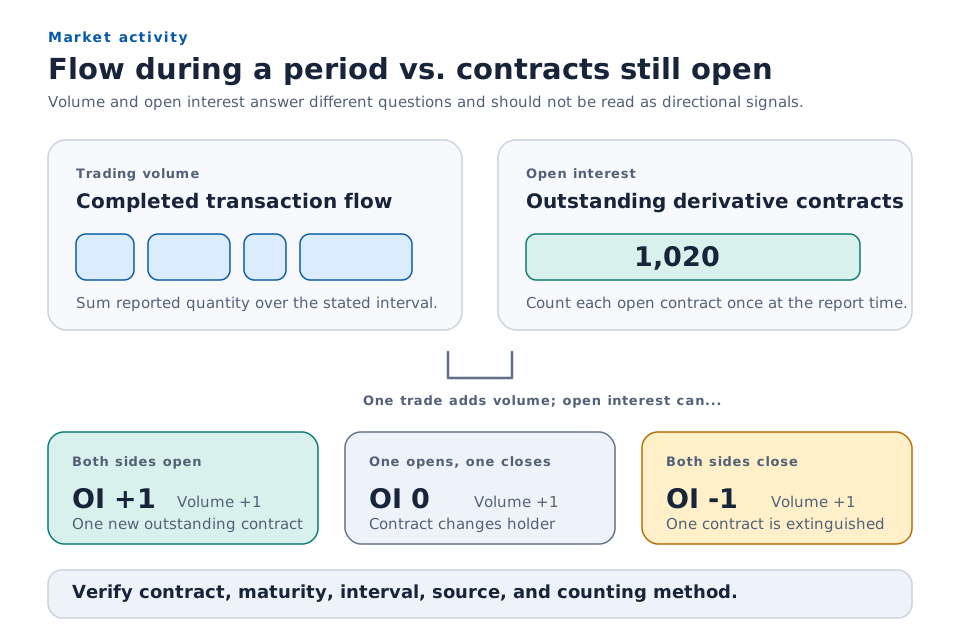
Trading volume counts completed activity during a period, while open interest counts derivative contracts that remain outstanding.
Trading volume is the quantity traded during a stated period. Open interest is the number of futures or options contracts that remain outstanding after positions have been opened, offset, exercised, delivered, expired, or otherwise closed under the market’s reporting method. Volume measures transaction flow; open interest measures a stock of open derivative contracts.
Neither measure shows whether an asset is a good investment or predicts the next price move. Both require the exact instrument, time period, data source, and counting method.
Key Takeaways
- Volume counts completed trading during an interval and normally starts fresh for the next interval.
- Open interest carries forward until contracts are closed, exercised, delivered, or expire.
- One open contract has a long side and a short side but is counted once, not twice.
- A futures or options trade can increase, leave unchanged, or decrease open interest depending on whether the parties are opening or closing positions.
- High volume or open interest can accompany liquidity, but neither guarantees a tight spread, sufficient depth, or an easy exit.
- Uptick volume is a methodology-dependent classification of volume, not proof of buying pressure or future gains.
Volume vs. Open Interest
| Measure | What it counts | Typical timing | Applies to | What it does not prove |
|---|---|---|---|---|
| Trading volume | Shares, contracts, units, or notional value traded | During a minute, session, day, month, or other interval | Cash and derivatives markets | Direction, fair value, or available liquidity |
| Open interest | Derivative contracts still outstanding | Commonly reported at the end of a session or reporting date | Futures and options | Daily activity, bullishness, or exit capacity |
How Trading Volume Is Counted
Volume adds completed transaction quantity over the selected interval:
Trading volume = sum of reported trade quantities during the interval
Suppose three trades occur in a stock during five minutes:
| Trade | Shares |
|---|---|
| 1 | 300 |
| 2 | 700 |
| 3 | 1,000 |
| Five-minute volume | 2,000 |
This total does not count resting orders that never traded. It also does not reveal whether more buyers or sellers remain in the market. Every completed trade has both sides.
Data vendors can differ because of market coverage, correction handling, delayed reports, auction prints, off-exchange transactions, time zones, and cut-off times. A comparison should use consistent definitions and sources.
Common Volume Measures
| Measure | Calculation or meaning | Useful context |
|---|---|---|
| Share volume | Shares traded | Activity in stocks and exchange-traded products |
| Contract volume | Contracts traded | Activity in options and futures |
| Notional or dollar volume | Price multiplied by traded quantity | Economic scale across differently priced instruments |
| Trade count | Number of reported transactions | Frequency, not quantity |
| Average daily volume | Mean daily volume over a stated lookback | Current activity relative to a baseline |
| Turnover ratio | Volume relative to shares outstanding, assets, or another denominator | Activity intensity when definitions match |
Raw volume should not be compared casually across instruments. One option contract, one futures contract, one bond trade, and one share represent different exposure. Notional volume can improve comparability, but it also requires a clear price, multiplier, currency, and methodology.
What Open Interest Measures
The CFTC defines open interest as futures or options contracts entered into and not yet offset or otherwise completed. Aggregate long open interest equals aggregate short open interest because each outstanding contract connects one long side with one short side.
For example:
| Position record | Count |
|---|---|
| Outstanding long sides | 500 |
| Outstanding short sides | 500 |
| Open interest | 500 contracts, not 1,000 |
Open interest is usually reported by contract and maturity. Combining months, option series, or products can hide where positions are concentrated. Options can also be reported using specialized methods, including futures-equivalent calculations in certain CFTC reports.
How Trades Can Change Open Interest
The following is a simplified teaching model. Exchanges and clearing organizations determine open interest from their records and reporting methods.
| Buyer | Seller | Volume effect | Open-interest effect |
|---|---|---|---|
| Opens a new long | Opens a new short | +1 contract | +1 contract |
| Opens a new long | Closes an existing long by selling | +1 contract | No change |
| Closes an existing short by buying | Opens a new short | +1 contract | No change |
| Closes an existing short | Closes an existing long | +1 contract | -1 contract |
The wording “buyer” and “seller” describes the transaction side, while “long” and “short” describe positions. A sale can open a short position or close a long position; a purchase can open a long position or close a short position.
Worked Example
Assume a futures contract begins the day with open interest of 1,000.
| Activity | Volume added | Open-interest change | New open interest |
|---|---|---|---|
60 new long-short pairs are opened | 60 | +60 | 1,060 |
25 contracts transfer from closing holders to opening holders | 25 | 0 | 1,060 |
40 opposing positions are closed | 40 | -40 | 1,020 |
| Daily result | 125 volume | +20 | 1,020 |
The day’s volume is 125 contracts even though open interest increased by only 20. Volume and open-interest change answer different questions.
Why These Measures Matter
Investors, analysts, exchanges, and risk teams use activity data to:
- compare current trading with a defined historical baseline
- judge whether an order is large relative to typical transaction flow
- identify which futures maturity or option series has more outstanding participation
- investigate unusual activity around news, index rebalancing, expiration, or market stress
- support market surveillance, clearing, margin, and operational reviews
- add context to spread, depth, volatility, and price-change analysis
These measures are evidence inputs, not conclusions. A contract with high open interest can still have poor displayed depth at a particular moment. A stock can show high daily volume because of one closing auction or block transaction while continuous trading remains thin.
Volume Is Not Liquidity
Liquidity is the ability to transact without disproportionate cost or delay. Volume records what traded; it does not show what can trade next.
Evaluate volume alongside:
| Liquidity evidence | Question answered |
|---|---|
| Bid-ask spread | What is the immediate quoted price gap? |
| Market depth | How much displayed size exists across prices? |
| Trade-size distribution | Did volume come from many ordinary trades or a few large prints? |
| Execution record | What price, size, delay, and slippage were actually realized? |
| Time profile | Was activity continuous or concentrated in an auction or event? |
High volume often appears in liquid markets, but it can also occur during disorderly conditions with wide spreads and rapid price changes.
What Is Uptick Volume?
Uptick volume generally means volume assigned to trades whose price is above a prior relevant trade price. Downtick volume assigns volume to lower-priced trades. When prices are unchanged, a methodology may use the last different price, a quote-based rule, a zero-tick category, or another classification.
The result depends on:
- whether the input uses trades, quotes, or both
- the venue coverage and consolidation process
- treatment of unchanged prices, corrections, and out-of-sequence reports
- the session and time interval
- whether volume is measured in shares, contracts, or notional value
Uptick volume does not identify the intent of every participant. Each trade has a buyer and seller, and trade classification methods can only infer or categorize activity from market data. It should not be presented as a standalone bullish signal.
How to Evaluate Volume and Open Interest
Use this sequence:
- Identify the instrument: security identifier, contract, maturity, option series, venue, and currency.
- Define the measure: shares, contracts, notional value, trade count, daily volume, average volume, or open interest.
- Set the period: start and end time, session, time zone, and comparison window.
- Check coverage: one venue, consolidated market, exchange total, or regulatory report.
- Review adjustments: corrections, cancellations, delayed reports, exercises, delivery, expiration, and contract rolls.
- Compare market quality: spread, depth, trade size, volatility, and execution results during the same period.
- State the limit: activity data describes observed participation, not future direction or suitability.
Common Mistakes and Limitations
- Adding long and short open positions together: one outstanding contract has both sides and is counted once.
- Treating volume as net buying: every completed trade has a buyer and seller.
- Using high open interest as a bullish signal: open interest does not identify the directional conviction of all holders.
- Assuming volume guarantees liquidity: activity can be concentrated, delayed, or accompanied by wide spreads.
- Comparing unlike contracts: a near-month futures contract and a distant maturity can have very different activity.
- Ignoring expiration and rolls: positions can migrate between contract months without representing a simple increase or decrease in economic exposure.
- Using an undefined uptick-volume series: classification methods can produce different totals from the same trading day.
- Mixing preliminary and final data: exchanges and vendors can revise volume and open-interest records.
Sources and Further Reading
- CFTC Futures Glossary: Open Interest
- CFTC Commitments of Traders Explanatory Notes
- CFTC: How to Read Futures Price Tables
- CME Group: What Is Volume?
Exchange and regulatory methods can change. Use the current source documentation for the exact contract, report, and date.
FAQs
Can volume rise while open interest falls?
Is open interest the sum of long and short positions?
Does high volume mean a price will rise?
Is open interest a complete measure of liquidity?
Related Terms
- Trade Lots, Odd Lots, and Block Trades: Quantity conventions and large-transaction classifications.
- Liquidity: Ability to transact without disproportionate cost or delay.
- Market Depth: Displayed orders across price levels.
- Market Quotes and Executable Prices: Bid, ask, spread, size, timing, and execution limits.
- Option: Derivative contract with exercise rights and obligations.
- Execution: Evidence that an order became one or more completed trades.
Educational Use
This article is for financial education only. It does not provide personalized investment or trading advice, recommend a derivative position, or replace current exchange, regulatory, legal, tax, or professional guidance.