Wide-Ranging Day
A wide-ranging day has an unusually large session high-low span under a stated benchmark. Learn the calculation, true range, gap effects, and limitations.
A wide-ranging day is a trading session whose high-low price span is unusually large relative to a stated historical or volatility benchmark. It describes the magnitude of movement within the session, not whether the instrument closed higher or lower and not what it will do next.
There is no universal threshold. A credible classification defines the session, price fields, comparison window, statistic, and cutoff before reviewing the outcome.
Key Takeaways
- Daily range equals the session high minus the session low.
- “Wide” must be defined relative to a benchmark, such as a rolling median range or true-range measure.
- A wide-ranging day can close higher, lower, or near where it opened.
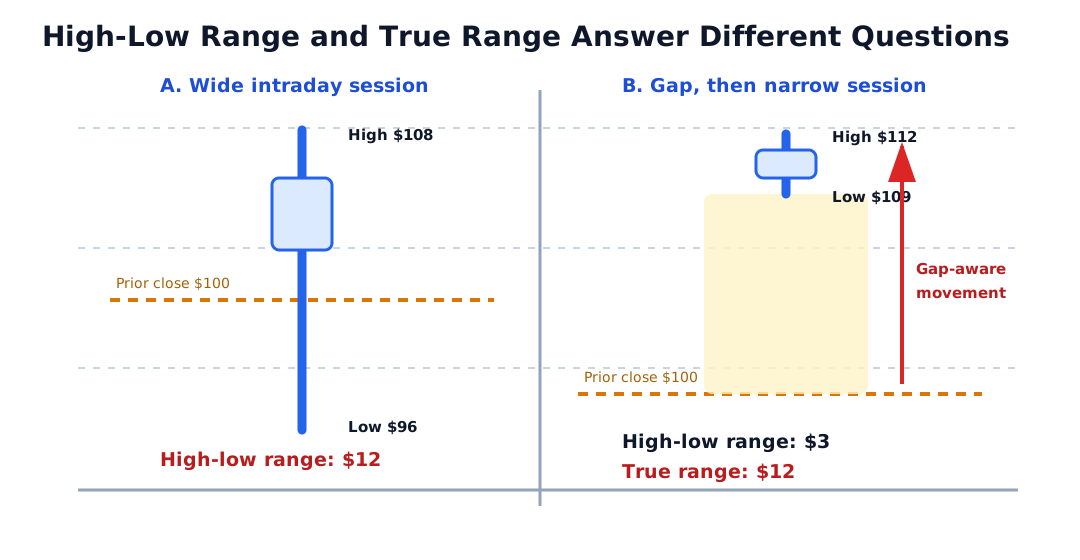
- High-low range compares only the current session’s extremes and can omit an overnight gap; true range adds comparisons with the prior close.
- Volume can add context but does not prove direction, conviction, or participant motive.
- A wide range can coincide with wide spreads and poor execution, especially around news or market stress.
Daily Range Calculation
For one defined trading session:
Daily range = session high - session low
If the high is $108 and the low is $96:
$108 - $96 = $12
The range as a percentage of a reference price can be calculated as:
Percentage range = daily range / reference price x 100
The reference might be the prior close, session open, midpoint, or another value. The analyst must name it because different denominators produce different percentages.
Worked Example: A Wide Intraday Session
Assume a stock has:
- prior close: $100
- session open: $102
- session high: $108
- session low: $96
- session close: $106
- prior 20-session median high-low range: $3
The daily range is:
$108 - $96 = $12
As a percentage of the prior close:
$12 / $100 x 100 = 12%
Relative to the prior median range:
$12 / $3 = 4 times the prior 20-session median
If the pre-declared rule labels any session above twice the prior 20-session median as wide-ranging, this session qualifies.
The close-to-close return is a separate measure:
($106 - $100) / $100 x 100 = 6%
The 12% intraday range is twice the 6% close-to-close return. Price traveled below the prior close and then finished above it. Reporting only the return would omit much of the path; reporting only the range would omit the net direction.
Daily Range vs. True Range
High-low range measures movement inside the selected session. It can understate movement from the prior close when the instrument gaps.
True range is the greatest of:
- current high minus current low;
- absolute value of current high minus prior close; or
- absolute value of current low minus prior close.
Consider a second session:
- prior close: $100
- open: $110
- high: $112
- low: $109
- close: $111
The high-low range is only:
$112 - $109 = $3
The other true-range candidates are:
- |$112 - $100| = $12
- |$109 - $100| = $9
True range is therefore $12. The session is narrow after it opens, but total movement from the prior close is large. This is why a “wide day” based only on high-low range and a high-volatility day based on true range are not always the same.
Range, Return, Body, and True Range Compared
| Measure | Formula | What it captures | What it misses |
|---|---|---|---|
| High-low range | High - low | Intraday price span | Direction and some gap context |
| Close-to-close return | (Close - prior close) / prior close | Net change across closes | Intraday path |
| Candle body | Absolute value of close - open | Net movement during the session | High and low outside the body |
| True range | Maximum of three gap-aware ranges | Largest movement involving high, low, and prior close | Sequence and liquidity |
| Average true range | Average or smoothed true range over a window | Recent scale of movement | Direction and future volatility |
An OHLC Chart displays the four session fields but does not show the order in which the high and low occurred.
How to Define “Wide”
Several reproducible methods are possible:
Multiple of a Rolling Median
Classify the current range relative to the median of the prior 20 sessions. The median is less sensitive than the mean to a few extreme observations. The number of sessions and multiple remain analyst choices.
Percentile Rule
Call the session wide if its range exceeds a selected percentile of historical ranges, such as the upper decile. The lookback period and treatment of ties must be stated.
Multiple of Average True Range
Compare the high-low range or true range with a previously calculated average true range. Avoid using an average that already includes the current extreme session if the goal is a prospective classification.
Fixed Percentage or Point Threshold
A rule can use a fixed percentage of price or number of points. This is easy to explain but may adapt poorly when price level or volatility changes.
Cross-Sectional Benchmark
Compare the security’s standardized range with peers or a market index on the same day. Differences in price, volatility, trading hours, and liquidity require normalization.
No method makes a wide range inherently bullish or bearish.
Directional and Two-Sided Wide Days
Two sessions can have the same $12 range and very different paths:
| Session shape | Open | High | Low | Close | Interpretation limit |
|---|---|---|---|---|---|
| Strong higher close | $97 | $108 | $96 | $107 | Shows a high close, not guaranteed continuation |
| Strong lower close | $107 | $108 | $96 | $97 | Shows a low close, not guaranteed further decline |
| Two-sided reversal | $102 | $108 | $96 | $102 | Large movement with little net open-close change |
| Gap and narrow trade | $110 | $112 | $109 | $111 | Small intraday range but large true range from prior close |
The closing location can add context. It does not reveal every intraday sequence or cause.
Volume, Breadth, and Liquidity Context
Trading Volume shows completed activity during the session. Comparing it with a rolling median can identify whether the wide range occurred with unusually high or low activity.
Additional context includes:
- bid-ask spread and displayed depth;
- number and size of trades;
- breadth across a sector or index;
- opening, closing, or reopening auctions;
- news and filing timestamps;
- market-wide or single-stock trading pauses; and
- whether the high or low came from a small, corrected, or unusual trade.
High volume does not prove that buyers or sellers “won.” Every completed trade has both sides, and public volume alone does not identify motive.
Data and Session Choices
A daily range is only as consistent as its data definition. Verify:
- regular session versus extended or overnight hours;
- official auction prices versus first and last continuous trades;
- trade-price data versus bid, ask, or midpoint data;
- adjusted versus unadjusted historical prices;
- treatment of splits, distributions, and futures rolls;
- venue-specific versus consolidated observations;
- timezone and holiday schedule; and
- corrections, canceled trades, and special conditions.
A split or contract adjustment can create a false historical range if the series is not prepared consistently.
Execution Risk on a Wide-Ranging Day
A large range does not mean every price between the high and low was available for meaningful quantity. The high or low may be one small trade, while spreads and depth can change throughout the session.
Market orders prioritize execution but can fill across several prices. Limit orders control the permitted price but can remain unfilled. Stop orders can activate during a short-lived move and execute away from the trigger. Actual outcomes require order acknowledgments, fills, and confirmations.
How to Evaluate a Wide-Ranging Day
- Define the instrument, venue, session, timezone, and price fields.
- Calculate high-low range and state the denominator for any percentage.
- Calculate true range when overnight or intersession gaps matter.
- Select the comparison window and threshold before classifying the session.
- Report open, close, return, and closing location separately from range.
- Compare volume, spread, depth, and breadth with documented baselines.
- Check news, auctions, halts, and data corrections without assuming causation.
- Distinguish the chart extremes from achievable execution prices.
- Test continuation and reversal claims across a full sample after costs.
Risks and Common Mistakes
- Calling a day wide without defining a benchmark.
- Treating a large range as the same as a large close-to-close return.
- Ignoring an overnight gap when true range is the relevant measure.
- Using the current extreme observation inside its own historical baseline without disclosure.
- Comparing raw point ranges across instruments with different prices.
- Assuming high volume predicts continuation.
- Assuming a high close means buyers controlled every part of the session.
- Treating the session high or low as an available fill for the required size.
- Ignoring splits, distributions, futures rolls, and bad ticks.
- Selecting a threshold after seeing which historical rule worked best.
Public Source Checks
- Investor.gov: Stock Quotes explains that historical quote information commonly includes daily open, close, high, low, and volume fields.
- CFTC: How to Read Futures Price Tables explains open, high, low, close, and settlement fields for futures markets.
- FINRA: Volatility explains market price swings and the associated uncertainty and risk.
- Investor.gov: Executing an Order explains why displayed market prices can differ from actual executions.
Related Terms
- OHLC Chart: Display of the open, high, low, and close used in range calculations.
- Stock Quote Price Fields: Definitions and caveats for session prices.
- Price Gap: Separation from a prior price range that true range can capture.
- Volatility: Broader concept describing variability or uncertainty in prices or returns.
- Whipsaw: Signal and rapid-reversal sequence that can occur during a wide session.
- Hammering the Market: Informal description of intensive selling rather than a range calculation.
FAQs
What is a wide-ranging day?
Is a wide-ranging day bullish or bearish?
What is the difference between daily range and true range?
Does a wide-ranging day predict the next session?
Educational Use
This article provides general market education, not personalized investment or trading advice. It does not recommend trading a wide range, gap, breakout, reversal, or volatility event.