Stock Liquidity
Stock liquidity is the ability to trade shares promptly, in meaningful size, without excessive price impact or transaction cost.
Stock liquidity is the ability to buy or sell shares promptly, in meaningful size, without causing excessive price movement or paying unusually high trading costs. A liquid stock generally has competitive quotes, enough available size, frequent trading, and an order book that recovers after trades.
Stock liquidity is narrower than general Liquidity. It focuses on the secondary-market trading conditions for a company’s shares, not on whether the company itself has enough cash.
Key Takeaways
- No single statistic proves that a stock is liquid.
- Spread, depth, trading activity, order size, market impact, and recovery all matter.
- Liquidity is specific to a time, venue, and order size; it can deteriorate quickly around news or market stress.
- A liquid stock can still be volatile, expensive, or unsuitable for a particular investor.
The Main Dimensions of Stock Liquidity
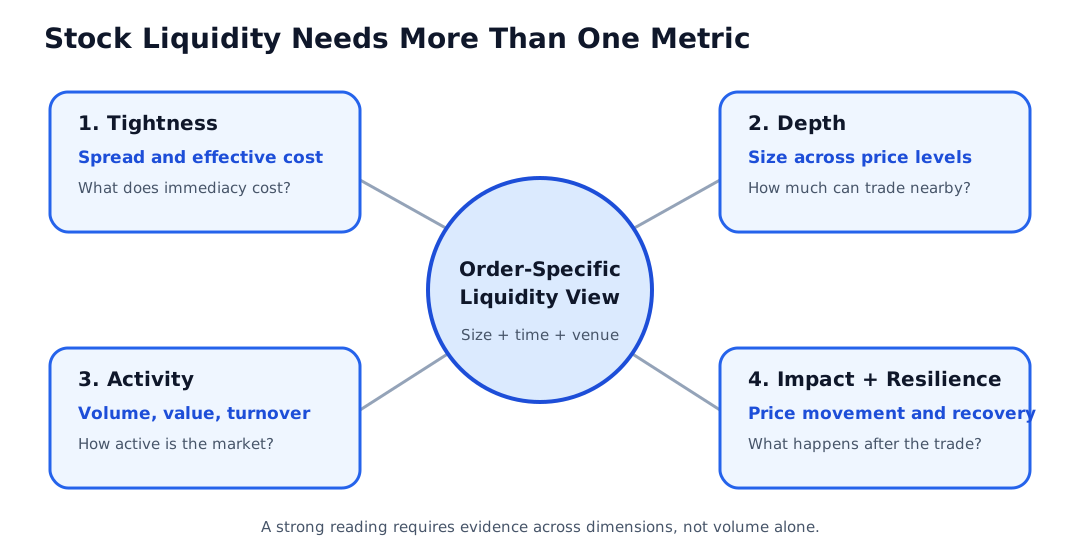
| Dimension | Question it answers | Evidence to review |
|---|---|---|
| Tightness | How costly is it to demand an immediate trade? | Bid-ask spread and effective spread |
| Depth | How much can trade near the current quote? | Shares and dollar value available across price levels |
| Activity | How often and how much does the stock trade? | Share volume, dollar volume, trade count, and turnover |
| Price impact | How far does an order move its own execution price? | Fill prices relative to an arrival benchmark |
| Resilience | How quickly does the market recover after an order or shock? | Spread, depth, and price behavior after trading pressure |
These dimensions can disagree. A stock may show a narrow top-of-book spread but little size behind it, or report high daily volume concentrated in one auction or a few large trades.
How Stock Liquidity Is Measured
Quoted Spread
The quoted spread is the difference between the best ask and best bid. Analysts often scale it by the quote midpoint so stocks with different prices can be compared:
If the best bid is $49.98 and the best ask is $50.02, the spread is $0.04 and the relative quoted spread is 0.08%. This is a snapshot, not a promise that an entire order can execute within that spread.
Depth and Book Walking
Market Depth shows the quantity displayed at the best prices and at additional levels. An order larger than the available quantity at the best quote may consume several levels of the Order Book, producing a worse volume-weighted average execution price.
Displayed depth is incomplete. Orders can be canceled, hidden, routed to other venues, or filled before another order arrives.
Volume and Turnover
Trading Volume measures completed activity during a period. Share turnover relates that activity to shares available or outstanding, depending on the definition used.
Volume is useful context, but an average can conceal intraday variation, unusual event days, or trading concentrated in opening and closing auctions. Dollar volume can also be more informative than share volume when comparing differently priced stocks.
Effective Cost and Market Impact
Actual fills reveal whether quoted liquidity was available to the order. Compare execution prices with a documented benchmark, such as the prevailing quote midpoint when the order reached the market. A large difference may reflect spread cost, Market Impact, delay, or unrelated price movement; these effects should not automatically be treated as the same thing.
Worked Comparison
Assume two stocks both trade near $50. A reader is evaluating a 1,000-share purchase during regular trading hours.
| Observation | Stock A | Stock B |
|---|---|---|
| Best bid / ask | $49.98 / $50.02 | $49.50 / $50.50 |
| Displayed shares at best ask | 5,000 | 200 |
| Typical daily share volume | 2,000,000 | 8,000 |
| Initial reading | Tighter and deeper | Wider and shallower |
Stock A appears more liquid for this order because its spread is narrower and its displayed ask size exceeds the order. Stock B’s order would exceed the displayed best-ask size and may need to trade at higher prices. That conclusion is still provisional: the quote may change, hidden liquidity may exist, and actual execution depends on order type, routing, timing, and market conditions.
Why Stock Liquidity Matters
Liquidity affects the price at which an investor can enter or exit, the capacity of a strategy, and the reliability of marked prices. It also matters to issuers and analysts because weak secondary-market liquidity can complicate valuation comparisons and increase the cost of executing large shareholder transactions.
Liquidity is not the same as investment quality. Active trading does not establish that a share is fairly valued, financially sound, or low risk.
When Liquidity Changes
Stock liquidity can vary with:
- order size and urgency
- time of day and whether the market is open
- company news, earnings announcements, offerings, or index changes
- broad volatility and market stress
- trading halts and auction conditions
- venue fragmentation and the availability of displayed or undisplayed interest
- changes in free float or concentrated ownership
Historical averages should therefore be matched to the intended trading window rather than treated as permanent characteristics.
How to Evaluate a Stock’s Liquidity
- Define the proposed order size, direction, timing, and urgency.
- Record the bid, ask, midpoint, and displayed size at the relevant time.
- Inspect depth beyond the best quote and identify which venues the data covers.
- Compare the order with recent dollar volume and normal trade sizes, not volume alone.
- Review actual fills against a stated benchmark and separate spread, impact, fees, and delay.
- Repeat the analysis across ordinary and stressed periods when the decision requires it.
Common Mistakes and Limitations
- Equating volume with liquidity: completed volume does not show the cost of the next trade.
- Ignoring order size: the same stock can be liquid for 100 shares and costly for 100,000 shares.
- Using the last trade as an executable price: the next available bid or ask may be different.
- Relying on one venue’s depth: displayed interest may be fragmented across markets.
- Assuming a limit order solves liquidity risk: a limit controls price but does not guarantee execution.
- Treating liquidity as stable: spreads and depth can change faster than historical averages imply.
This page is educational only. It does not recommend a stock, broker, venue, order type, or trading strategy and should not be treated as personalized investment or trading advice.
Sources and Further Reading
- Investor.gov: Liquidity or Marketability
- Investor.gov: Executing an Order
- SEC: Market Structure Analytics
- SEC: Order Book Reporting Methods and Their Impact on Market Activity Measures
FAQs
Does high trading volume always mean a stock is liquid?
Can a widely held stock become illiquid?
Does a narrow bid-ask spread guarantee a good execution?
Related Terms
- Liquidity: The broader ability to trade an asset or raise cash without excessive cost or delay.
- Market Depth: Displayed interest across price levels.
- Bid-Ask Spread: The gap between the best displayed bid and ask.
- Market Impact: Price pressure attributable to executing an order.
- Transaction Cost: Explicit and implicit costs associated with a trade.