Order Book Depth
Order book depth is displayed buy and sell quantity across price levels. Learn cumulative depth, book-walking VWAP, slippage, and key limitations.
Order book depth is the displayed quantity of buy and sell interest available across multiple price levels in a selected order book at a specific time. It shows how much visible size is posted at the best bid and ask and at less competitive prices beyond them.
Depth helps estimate how an order might interact with a snapshot of the book. It does not guarantee those orders will remain available, and it excludes liquidity that is hidden, held elsewhere, or not covered by the feed.
Key Takeaways
- Top-of-book size covers only the best displayed bid and ask; depth includes additional levels.
- Cumulative depth is the total displayed quantity through a selected price boundary.
- An order larger than the best-level size may execute across several prices, called walking the book.
- Depth is side-specific, venue-specific, timestamp-sensitive, and dependent on the data feed.
- More displayed quantity does not automatically mean low execution cost or stable liquidity.
- Actual execution must be measured from fills, not inferred from a screenshot.
How Order Book Depth Is Displayed
A depth ladder commonly shows price, displayed quantity at that price, and cumulative quantity from the best price outward.
| Ask price | Displayed quantity | Cumulative ask depth |
|---|---|---|
| $50.02 | 300 shares | 300 shares |
| $50.03 | 400 shares | 700 shares |
| $50.05 | 900 shares | 1,600 shares |
| Bid price | Displayed quantity | Cumulative bid depth |
|---|---|---|
| $50.00 | 500 shares | 500 shares |
| $49.99 | 800 shares | 1,300 shares |
| $49.97 | 1,200 shares | 2,500 shares |
The best ask is $50.02 and the best bid is $50.00. A small marketable buy interacts with the ask side, while a marketable sell interacts with the bid side. The two sides should not be added together when estimating one order’s immediate execution.
Worked Example: Walking the Ask Side
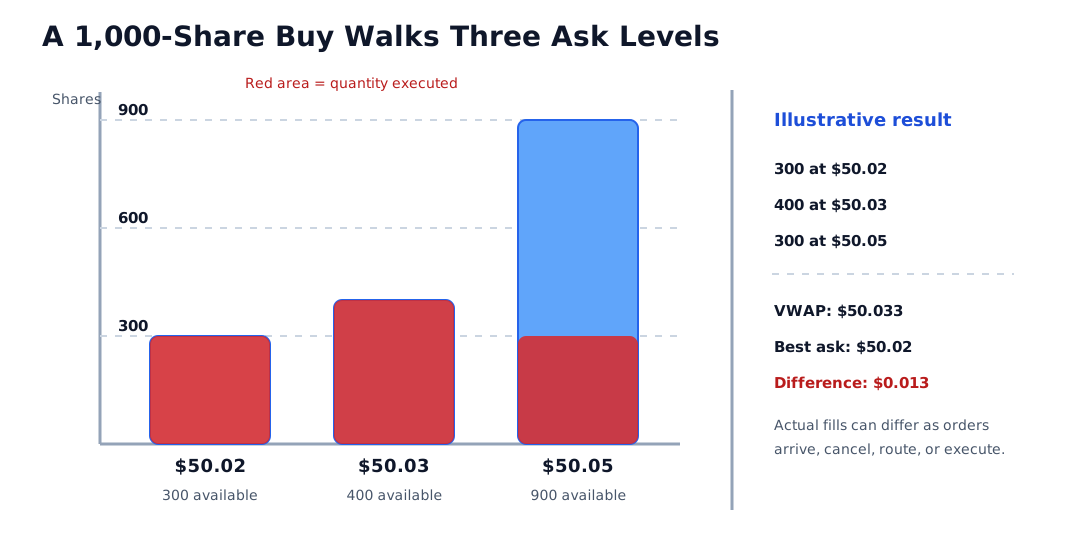
Suppose a marketable buy for 1,000 shares reaches the simplified ask ladder above while every displayed order remains available.
The fills would be:
| Fill | Shares | Price | Gross value |
|---|---|---|---|
| 1 | 300 | $50.02 | $15,006 |
| 2 | 400 | $50.03 | $20,012 |
| 3 | 300 | $50.05 | $15,015 |
| Total | 1,000 | $50,033 |
The volume-weighted average price, or VWAP for this order, is:
$50,033 / 1,000 = $50.033 per share
Compared with the original $50.02 best ask, the gross depth-related slippage is:
$50.033 - $50.02 = $0.013 per share
Across 1,000 shares:
$0.013 x 1,000 = $13 before commissions, fees, taxes, or further market movement
This is a static-book estimate, not an execution promise. During the order’s travel and matching time, displayed asks can cancel, new asks can arrive, hidden quantity can execute, another participant can trade first, or the order can route to multiple venues. Actual VWAP belongs to the execution reports.
Common Measures of Depth
Best-Level Depth
This is displayed size at the best bid or best ask. It is easy to observe but says little about a larger order that would consume more than one level.
Cumulative Depth Through a Price
This adds displayed quantity from the best price through a selected limit. In the example, cumulative ask depth through $50.03 is 700 shares. A buy limit of $50.03 cannot execute against the $50.05 level.
Depth Within a Price or Basis-Point Band
An analyst can total quantity within a fixed distance of the midpoint or best quote. This provides a more consistent rule than counting an arbitrary number of levels, but the band and reference price must be stated.
Notional Depth
Share or contract quantity can be converted to currency value:
Notional depth at a level = price x displayed quantity
Notional values can improve comparisons across instruments with different prices, but contract multipliers, currencies, and tick values must be handled consistently.
Depth Slope or Shape
Some analysis compares how quickly cumulative quantity increases as price moves away from the top. A steep depth curve can indicate substantial displayed quantity nearby. The result depends heavily on the chosen snapshot, normalization, and venue coverage.
No one depth metric is universally correct. The measure should match the proposed order size and execution question.
Order Book Depth vs. Market Depth
The terms are often used interchangeably, but context can distinguish them:
| Term | Narrow meaning | Broader interpretation |
|---|---|---|
| Order book depth | Displayed quantity in a selected electronic book or feed | Directly observable venue data |
| Market Depth | Ability to absorb size across prices | May consider several venues and non-book liquidity |
| Liquidity | Ability to trade without excessive cost or delay | Includes spread, depth, resilience, immediacy, and execution conditions |
| Trading Volume | Quantity already traded during a period | Historical activity, not current resting size |
A heavily traded instrument can have little displayed depth at one instant. A book can show substantial depth that cancels before it trades. Volume and depth answer different questions.
Depth, Spread, and Market Impact
Depth should be read together with the Bid-Ask Spread. Four simplified conditions illustrate why:
| Spread | Nearby depth | Possible interpretation |
|---|---|---|
| Narrow | High | Small orders may face low visible friction |
| Narrow | Low | Quote looks competitive but may support little size |
| Wide | High | Size is displayed, but immediate trading starts with a larger concession |
| Wide | Low | Both spread and depth indicate potentially difficult execution |
Market Impact is the price change associated with executing or revealing an order. A static depth calculation estimates mechanical book walking. It does not capture new order submissions, cancellations, signaling effects, or subsequent price response.
Why Displayed Depth Changes
Depth can change because:
- orders execute, cancel, expire, or are modified;
- participants react to trades, news, volatility, and inventory risk;
- orders reprice under pegging or protection rules;
- reserve quantity refreshes;
- routing moves interest among venues;
- the market enters an opening, closing, reopening, or volatility auction;
- a trading halt interrupts continuous matching; or
- the data feed drops, delays, samples, or aggregates messages.
The rate at which depth returns after a trade is sometimes called resilience. One deep snapshot does not establish that the market will replenish after a large order.
Displayed Depth Is Not Total Liquidity
The visible ladder can miss:
- non-displayed and reserve orders on the same venue;
- interest on other exchanges or trading systems;
- dealer internalization and bilateral liquidity;
- conditional orders not yet active;
- orders held or sliced by a broker or algorithm; and
- future liquidity that appears only after price changes.
Conversely, visible size may not be reachable. It can cancel, execute against another order, or sit behind conditions not obvious from a simple screen. A feed’s technical specification controls what its quantity fields mean.
Comparing Depth Across Instruments
Raw share counts are often misleading. A useful comparison may normalize for:
- instrument price and notional value;
- contract multiplier and tick value;
- typical order size;
- free float or units outstanding;
- average or median trading activity;
- distance from the midpoint in basis points;
- venue market share and feed coverage; and
- time of day and market state.
Compare like sessions with like sessions. The opening auction, midday continuous trading, and a volatile close can have very different depth profiles.
How to Evaluate Depth for an Order
- Identify the instrument, side, quantity, venue, session, and timestamp.
- Confirm whether the feed is top-of-book, level-book, or order-by-order.
- Measure cumulative opposite-side depth only through the order’s worst acceptable price.
- Estimate fills level by level and calculate the gross weighted-average price.
- Separate displayed depth from hidden and off-venue liquidity.
- Allow for latency, queue competition, cancellations, and partial fills.
- Include fees and any relevant currency or contract conversion.
- Compare the estimate with order acknowledgments and actual executions.
- Preserve failed estimates instead of evaluating only favorable fills.
Risks and Common Mistakes
- Snapshot risk: Depth can change before the order arrives.
- Coverage risk: One venue or feed may show only part of the market.
- Cancellation risk: Displayed quantity can disappear without trading.
- Hidden-liquidity risk: Visible size can understate executable quantity.
- Queue risk: Other orders may have priority at the same price.
- Scaling error: Raw shares do not provide comparable economic size across instruments.
- Side error: Bid depth does not fund a marketable buy; ask depth does.
- Volume confusion: Past trading volume is not current depth.
- Direction error: A deep bid does not guarantee price support or an advance.
- Cost omission: Static book walking omits fees, signaling, routing, and dynamic impact.
Public Source Checks
- SEC: Order Book Reporting Methods explains the difference between order-based and level-book exchange feeds.
- SEC: Hidden Volume Ratios describes hidden limit-order executions and the limits of visible exchange data.
- NYSE: Integrated Feed describes a venue feed containing order-by-order depth, trades, imbalances, and security-status messages.
- Investor.gov: Executing an Order explains routing and why the displayed market price can differ from an investor’s execution.
Related Terms
- Limit Order Book: Price-ranked venue record from which displayed depth is measured.
- Order Queue: Execution priority among eligible orders at one price.
- Order Imbalance: Difference between eligible buy and sell interest under a stated method.
- Market Order: Order that can consume several displayed levels.
- Limit Order: Price-controlled order that may consume liquidity or join the book.
- Transaction Cost: Broader set of explicit and implicit costs associated with execution.
FAQs
Is more order book depth always better?
What is cumulative order book depth?
Does depth show the price of a large market order?
Is order book depth the same as trading volume?
Educational Use
This article provides general market-structure education. It does not provide personalized investment or trading advice and does not recommend an order size, venue, security, or execution method.