Order Imbalance
Order imbalance is excess eligible buy or sell interest under a defined market calculation. Learn auction pairing, imbalance measures, and limitations.
An order imbalance is the excess of eligible buy interest over eligible sell interest, or vice versa, under a specified market calculation at a stated time and reference price. A buy imbalance means more qualifying quantity is seeking to buy than can currently be paired with qualifying sell quantity; a sell imbalance means the reverse.
The term does not simply count orders. One order for 100,000 shares can outweigh hundreds of smaller orders. It also does not have one universal formula: auction feeds, displayed order books, and order-flow studies measure different populations.
Key Takeaways
- Imbalance is based on eligible quantity, not merely the number of orders.
- The calculation needs a market event, timestamp, reference price, and inclusion rules.
- Auction imbalance, displayed-book imbalance, and executed order-flow imbalance are different measures.
- Paired quantity and unmatched imbalance should be reported separately.
- A buy imbalance does not guarantee a higher auction price or later price increase.
- Exchange feeds update as orders enter, cancel, reprice, or become eligible, so one reading can become stale quickly.
A Simplified Imbalance Calculation
For a basic illustration at one candidate matching price:
Net imbalance = eligible buy quantity - eligible sell quantity
- A positive result represents a buy imbalance under this sign convention.
- A negative result represents a sell imbalance.
- Zero means the eligible quantities are equal under the selected calculation, not that every market participant agrees on value.
The sign convention is not universal. A data provider may publish side and absolute quantity rather than a signed number. Always read the feed specification.
Worked Auction Example
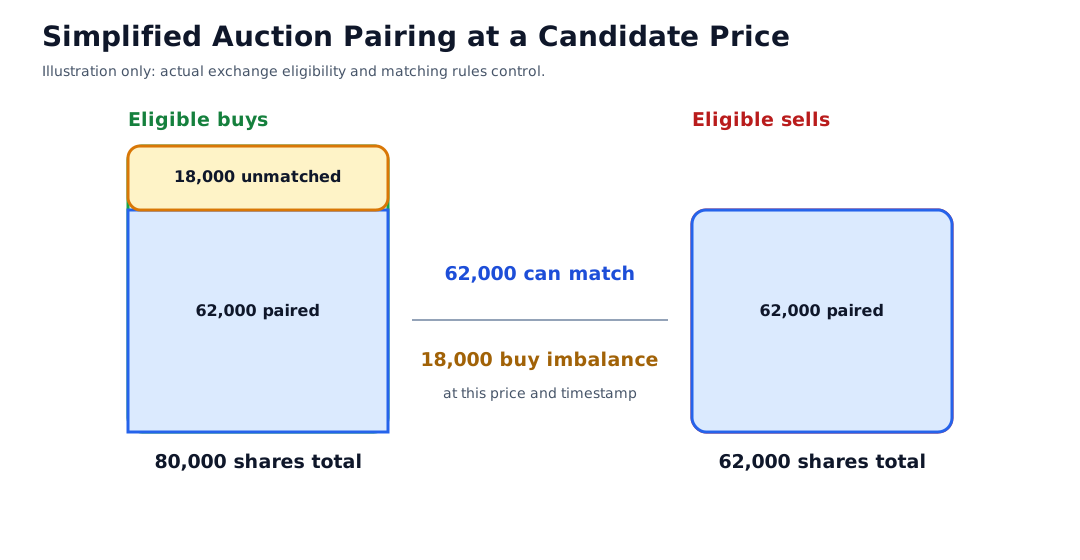
Assume a simplified auction calculation at a $25.00 reference price identifies:
| Eligible interest | Quantity |
|---|---|
| Buy quantity | 80,000 shares |
| Sell quantity | 62,000 shares |
The maximum quantity that can be paired in this simplified example is the smaller side:
Paired quantity = 62,000 shares
The remaining buy imbalance is:
80,000 - 62,000 = 18,000 shares
An analyst-defined normalized imbalance ratio could be:
(80,000 - 62,000) / (80,000 + 62,000) = 12.68%
That ratio is useful only if the analyst documents the formula. It is not presented here as an official exchange field.
Now suppose the candidate match price changes to $25.02 and the eligible quantities become 65,000 buys and 64,000 sells. The simplified paired quantity rises to 64,000, while the buy imbalance falls to 1,000. The example shows why imbalance depends on the candidate price and eligible order population.
An actual auction applies the venue’s order types, priorities, reference prices, collars, cutoff times, and matching algorithm. The exchange’s published result controls; the simplified arithmetic does not reproduce every rule.
Auction Imbalance vs. Other Imbalance Measures
| Measure | Data population | Typical question | Main limitation |
|---|---|---|---|
| Auction imbalance | Orders eligible for a specified opening, closing, reopening, or halt auction | How much eligible interest remains unmatched at a candidate price? | Venue and event rules determine eligibility |
| Displayed-book imbalance | Visible bid size compared with visible ask size in selected levels | Is displayed depth heavier on one side right now? | Omits hidden and uncovered liquidity |
| Order-flow imbalance | Classified buy-initiated and sell-initiated trades or order events | Which side was more aggressive over a period? | Classification and formula vary |
| Position imbalance | Difference between desired and current portfolio exposure | How much must a participant trade? | Private information, not a market-feed field |
Calling all four simply “order imbalance” hides material differences. A useful statement names the measure, venue, interval, and units.
How Auction Imbalance Information Works
Before an opening or closing cross, an exchange may publish changing information about eligible interest. Depending on the venue, fields can include:
- imbalance side and quantity;
- paired or matched quantity;
- reference price;
- indicative match or clearing price;
- market-order imbalance;
- total imbalance;
- auction collars or price ranges; and
- timestamps or freeze-state indicators.
These labels are not interchangeable. NYSE, for example, separately defines Total Imbalance and Market Imbalance in its auction information. Nasdaq publishes a Net Order Imbalance Indicator for its opening and closing crosses. Each venue’s specification and rulebook determine which orders enter each field.
The values update because participants can add, cancel, or modify eligible orders during permitted periods and because the reference or indicative price can change. Near a cutoff or freeze, different restrictions may apply.
Paired Quantity Is Not the Same as Imbalance
Consider two auction states:
| State | Buy quantity | Sell quantity | Paired quantity | Imbalance |
|---|---|---|---|---|
| A | 80,000 | 62,000 | 62,000 | 18,000 buy |
| B | 20,000 | 2,000 | 2,000 | 18,000 buy |
Both have the same absolute imbalance, but State A has much more offsetting interest and potential matched volume. Reporting only 18,000 shares loses important context.
The imbalance should be evaluated with paired quantity, reference or indicative price, recent updates, normal auction volume, and the security’s liquidity. Raw quantities are not directly comparable across securities with different prices, floats, and trading activity.
Why an Imbalance Can Affect Price Discovery
An auction seeks a price at which eligible buying and selling interest can be matched under its rules. If buy interest exceeds sell interest at one candidate price, a different price may make more sell orders eligible or fewer buy orders eligible. The matching algorithm evaluates the permitted price range and applicable priorities.
That mechanism can connect imbalance with an indicative price, but it does not create a simple forecast:
- new offsetting orders can reduce the imbalance;
- orders can cancel or change before a cutoff;
- the reference price and candidate match price can move;
- non-displayed or conditional interest may enter the calculation under specific rules;
- auction collars can constrain the match; and
- continuous trading after the auction can reverse the move.
The final auction print is evidence of the completed match. An earlier imbalance message is evidence of an earlier eligible-order state.
Displayed-Book Imbalance
Outside an auction, an analyst may compare displayed bid and ask depth. For example:
Displayed depth imbalance = (bid depth - ask depth) / (bid depth + ask depth)
The formula must specify:
- how many price levels or basis points are included;
- which venues and feed types are covered;
- whether quantities are shares, contracts, or notional value;
- the sampling timestamp or interval; and
- treatment of hidden, reserve, odd-lot, and crossed-market conditions.
A large visible bid can cancel or be executed. It may also reflect market making, hedging, inventory management, or a temporary order rather than a directional view. Displayed-book imbalance should not be described as verified investor sentiment.
Executed Order-Flow Imbalance
Research and trading systems sometimes classify completed trades as buyer-initiated or seller-initiated and compare the quantities. That is not the same as subtracting resting bid and ask depth.
Trade-side classification can be uncertain when timestamps differ, quotes update rapidly, or transactions occur inside the spread. Some methods count trades, some use quantity, and others analyze order additions, cancellations, and executions. Results from different methods need not agree.
The method should be documented before interpreting a positive or negative value.
What an Order Imbalance Does Not Prove
An imbalance does not by itself prove:
- the identity or motive of the participants;
- whether the interest is informed, speculative, hedging, or mechanical;
- that displayed or eligible orders will remain;
- that a particular order can execute at the indicative price;
- that the auction price will move in the imbalance direction; or
- that any post-auction movement will continue.
An imbalance is a market-state measurement. Turning it into a forecast requires a separately defined and tested model.
How to Evaluate an Imbalance Reading
- Identify the venue, instrument, market event, and timestamp.
- Name the feed field rather than relying on the generic word “imbalance.”
- Confirm the reference or indicative price used in the calculation.
- State which order types and quantities are eligible.
- Record the side, absolute quantity, paired quantity, and units.
- Compare with normal activity using a documented baseline.
- Track updates rather than relying on one stale snapshot.
- Review cutoff, freeze, collar, priority, and matching rules.
- Separate the indicative state from the final auction print and later trading.
- Use order and execution records to evaluate an actual transaction.
Risks and Common Mistakes
- Order-count error: Counting orders rather than eligible quantity.
- Field confusion: Treating total, market, net, and paired fields as synonyms.
- Scope error: Mixing auction interest with continuous-book depth.
- Static-snapshot error: Ignoring later additions, cancellations, and price changes.
- Normalization error: Comparing raw share imbalances across unlike securities.
- Hidden-interest error: Assuming every eligible or potential order is displayed.
- Direction error: Treating a buy imbalance as a guaranteed price increase.
- Causation error: Assigning the imbalance to news or institutions without evidence.
- Execution error: Treating an indicative match price as a guaranteed fill.
- Rule error: Applying one exchange’s fields or timing to another venue.
Public Source Checks
- NYSE: Auctions publishes current auction timelines and distinguishes fields such as Total Imbalance, Market Imbalance, Paired Quantity, Indicative Match Price, and Reference Price.
- Nasdaq Trader: Opening and Closing Crosses describes the Net Order Imbalance Indicator and its role before Nasdaq opening and closing crosses.
- NYSE: Integrated Feed describes a venue-specific order-by-order feed that includes depth, trades, order imbalances, and status messages.
- SEC: Order Book Reporting Methods explains why order-based and level-book reporting methods can produce different activity measures.
Related Terms
- Limit Order Book: Price-ranked resting interest that can be measured in continuous trading.
- Order Book: Venue or feed view of current buy and sell interest.
- Order Book Depth: Displayed size across price levels.
- Order Queue: Priority among eligible resting orders at one price.
- Market-on-Close Order: Order intended for execution in a closing process under applicable terms.
- Trading Volume: Completed activity that should not be confused with unmatched order interest.
FAQs
What is a buy order imbalance?
Does a buy imbalance mean the price will rise?
Is order imbalance based on the number of orders?
Is auction imbalance the same on every exchange?
Educational Use
This article provides general market-structure education. It does not provide personalized investment or trading advice and does not recommend trading from an imbalance reading or participating in an auction.