Whipsaw
A whipsaw is a move through a trading signal followed by a rapid reversal. Learn how to define it, measure a worked example, and evaluate execution risk.
A whipsaw is a price move that crosses a defined trading signal or boundary and then reverses rapidly enough to invalidate the original directional interpretation or trigger an opposing signal. The term is commonly used when a breakout, trend-following, or stop-based rule reacts to the first move and is harmed by the reversal.
A losing trade is not automatically a whipsaw. The analyst should identify the original level, confirmation rule, reversal rule, and time window before applying the label.
Key Takeaways
- A whipsaw requires a sequence: initial signal, entry or interpretation, then rapid reversal.
- The boundary and confirmation rule determine whether the first move qualified.
- Volatility increases the opportunity for large reversals but is not the same concept.
- Stop orders can execute away from their trigger price in fast markets.
- Requiring more confirmation can reduce some false signals but can also delay entry or increase the price paid.
- No filter eliminates whipsaws, and one historical example does not prove a rule is effective.
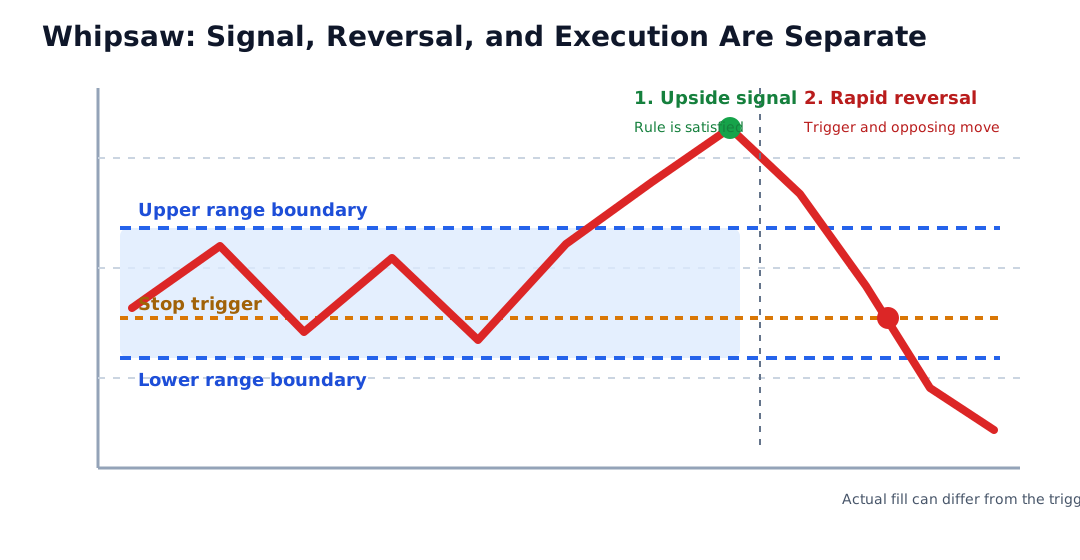
The Sequence That Defines a Whipsaw
A useful whipsaw description contains at least four elements:
- Reference: The trend line, range boundary, moving average, indicator threshold, or other rule being monitored.
- Initial signal: The observation that satisfied the entry or directional condition.
- Reversal: The later price move that invalidated the initial signal.
- Timing: The maximum interval allowed between the first signal and reversal.
Without those elements, the word often becomes hindsight commentary. For example, “price rose and later fell” is not sufficiently precise. “A five-minute close exceeded the pre-marked range high by 0.5%, then a five-minute close fell below the range low within 30 minutes” is reproducible.
Worked Example
Assume a stock has traded inside a range from $99.00 to $100.00. Before the session, an analyst defines:
- upside signal: a five-minute close at least 0.5% above $100.00;
- long entry: next available trade after the confirming close;
- invalidation level: $99.80 stop trigger;
- whipsaw window: reversal within six five-minute bars; and
- opposing signal: a five-minute close below $99.00.
The upside threshold is:
$100.00 x 1.005 = $100.50
Suppose a five-minute bar closes at $100.70, satisfying the pre-defined signal. The next available purchase fills 500 shares at $100.80. Price then reverses, reaches the $99.80 stop trigger, and the resulting market order fills at $99.55 during a fast decline.
The gross loss is:
($100.80 - $99.55) x 500 = $625
Commissions, fees, taxes, and any later transactions are excluded. The $0.25 difference between the stop trigger and execution is:
$99.80 - $99.55 = $0.25 per share
If a later five-minute bar closes at $98.90 within the six-bar window, the full sequence meets the stated whipsaw definition: confirmed upside move, rapid reversal, stop activation, and opposing downside signal.
The example does not show that the signal or stop was appropriate. It shows how chart rules and transaction records should be separated.
Signal, Order, and Fill Are Different Records
| Stage | Evidence | What it establishes |
|---|---|---|
| Reference level | Saved chart or rule configuration | Boundary existed before the outcome |
| Signal | Timestamped market data and calculation | Price met the analytical rule |
| Order submission | Order ticket and broker acknowledgment | Instruction was sent and accepted |
| Stop trigger | Broker or venue event record | Trigger condition was recognized |
| Execution | Fill report or confirmation | Actual price and quantity traded |
| Position outcome | Account and transaction ledger | Realized or unrealized result after costs |
A chart can show a theoretical whipsaw even when no order was placed. A real transaction can also perform differently from a backtest because of spread, latency, queue priority, partial fills, and gaps.
Whipsaw vs. Similar Terms
| Term | Required observation | Main distinction |
|---|---|---|
| Whipsaw | Signal in one direction followed quickly by invalidation or an opposing signal | Defined relative to a rule and sequence |
| False Breakout | Price moves beyond a boundary and returns | Can be one component of a whipsaw |
| Reversal | Price structure changes direction under a stated method | May persist rather than reverse back rapidly |
| Volatility | Magnitude or dispersion of price changes | Does not require a trading signal |
| Ordinary fluctuation | Price varies within expected noise or range | May never cross the relevant boundary |
| Losing trade | Position produces a negative result | Loss can occur without a reversal signal |
The same price path can be a whipsaw for one rule and not another. A daily trend model may ignore movement that repeatedly whipsaws a one-minute strategy.
Where Whipsaws Commonly Appear
Whipsaw risk can arise around:
- range breakouts and breakdowns;
- moving-average crossovers;
- momentum or oscillator thresholds;
- trend-line breaks;
- opening-range boundaries;
- stop-entry and stop-loss levels;
- news releases, auctions, and trading resumptions; and
- thin or fragmented markets where small trades move displayed prices.
These settings do not prove a whipsaw will occur. They are situations in which a rule can respond to a temporary move before the market reverses.
Why a Price Path Can Reverse Rapidly
Several mechanisms can be consistent with the observation:
- new information changes the market’s interpretation;
- an initial order imbalance is offset by later interest;
- a thin book allows price to move through several levels and then refill;
- stop and market orders interact with limited depth;
- an opening or reopening auction differs from later continuous trading;
- a large participant completes an order;
- dealers hedge or rebalance inventory; or
- the first move reflects noise rather than a durable change.
Public price data rarely establish which mechanism dominated. Analysts should avoid inventing a causal story from the shape alone.
Confirmation Filters and Their Tradeoffs
| Filter | Intended effect | Tradeoff |
|---|---|---|
| Closing-price rule | Ignore brief intrabar crossings | Waits until the bar ends |
| Percentage or tick buffer | Require movement beyond the boundary | Enters farther from the original level |
| Time confirmation | Require price to remain beyond the level | Can miss fast moves or worsen entry |
| Volume threshold | Require activity above a benchmark | Volume can be high during failed moves too |
| Retest rule | Wait for price to revisit and hold the boundary | Retest may never occur or may still fail |
| Higher timeframe | Reduce reaction to short-interval noise | Produces fewer and later signals |
Every filter changes both false-signal frequency and opportunity cost. A filter should be evaluated across a representative sample with transaction costs, not selected after one unfavorable trade.
Stop Orders and Fast Reversals
A stop price is a trigger, not a guaranteed execution price. Once activated under its terms, a stop order can become a market order and trade at the next reasonably available prices. During a whipsaw, those prices may differ materially from the trigger.
A stop-limit order adds a limit price, which controls the permitted execution range but creates non-fill risk. If price moves through the limit, the position can remain open while losses continue. Neither order type removes market risk.
Testing a Whipsaw-Prone Rule
A credible test should document:
- instrument universe and sample dates;
- data source, session, timezone, and bar interval;
- unadjusted or adjusted price treatment;
- exact signal, reversal, and timing rules;
- spread, commission, fee, slippage, and delay assumptions;
- treatment of gaps, partial fills, halts, and delistings;
- number of signals, not only successful examples; and
- results outside the period used to choose parameters.
Look-ahead bias occurs if the rule uses information unavailable at the decision time. Survivorship bias occurs if failed or delisted instruments are omitted. Parameter selection after reviewing outcomes can make a filter appear more effective than it was prospectively.
How to Review a Whipsaw Event
- Retrieve the original signal definition and timestamp.
- Verify that the first move actually met the rule.
- Identify when and how the reversal condition was met.
- Compare trade, quote, and bar data at a suitable resolution.
- Review spread and order-book depth around both moves.
- Reconcile each order, trigger, partial fill, cancellation, and fee.
- Separate losses caused by the signal from losses caused by execution.
- Check whether the same rule was applied to non-whipsaw outcomes.
- Avoid assigning motive or manipulation without separate evidence.
Risks and Common Mistakes
- Defining the whipsaw only after seeing the reversal.
- Calling any losing trade or volatile session a whipsaw.
- Changing the confirmation rule after an unfavorable result.
- Treating a stop trigger as the expected fill price.
- Ignoring bid-ask spread, depth, latency, gaps, and partial fills.
- Assuming high volume confirms the first move.
- Using a filter that removes historical losses while ignoring missed gains.
- Applying intraday conclusions to a long-horizon portfolio without context.
- Claiming news, algorithms, or stop orders caused the move without evidence.
- Assuming diversification prevents a strategy-specific whipsaw loss.
Public Source Checks
- FINRA: Stop Orders During Volatile Markets explains that short-lived dramatic price changes can trigger stop orders and that executions can differ from stop prices.
- FINRA Regulatory Notice 16-19 discusses stop-order risks and price dislocations during volatile conditions.
- Investor.gov: Executing an Order explains routing, delay, and why a displayed quote may differ from the execution.
- FINRA: Volatility provides investor education on market swings and risk without treating volatility as a prediction.
Related Terms
- Breakout: Boundary crossing that can fail and form the first part of a whipsaw.
- Reversal: Change in directional price structure under a stated rule.
- Stop-Loss Order: Triggered instruction whose fill can differ from the stop price.
- Bid-Ask Spread: Trading friction that can widen during rapid movement.
- Order Book Depth: Visible quantity that affects potential slippage.
- Wide-Ranging Day: Session with an unusually large high-low span.
FAQs
What is a whipsaw in trading?
Is every false breakout a whipsaw?
Can a stop-loss order prevent a whipsaw loss?
Can confirmation eliminate whipsaws?
Educational Use
This article provides general market education, not personalized investment or trading advice. It does not recommend a signal, stop, order type, timeframe, or strategy.