Market Data, Stock Tickers, and Ticker Tapes
Market data includes quotes, trades, identifiers, reference fields, tickers, and tape records whose source and timing determine how they can be used.
Market data is information about financial instruments and market activity, including quotes, trades, prices, volume, timestamps, identifiers, reference fields, and order-book depth. A stock ticker presents selected fields by symbol, while a ticker tape is a chronological stream of reported market events. Each is evidence about a market state, not a guarantee of the next execution price.
The practical question is not merely whether a number appeared on a screen. A reader must identify what field it was, which instrument and venue it described, when it was generated, how it reached the display, and whether it represented a quote, completed trade, reference value, or vendor calculation.
Key Takeaways
- Market data includes quote, trade, depth, reference, corporate-action, and derived fields.
- A ticker symbol is an identifier, a stock ticker is a display, and a ticker tape is a stream of market updates.
- Real-time, delayed, end-of-day, and historical data answer different questions.
- Consolidated feeds, direct venue feeds, and vendor products can differ in coverage, latency, normalization, and field definitions.
- A last-sale print records a completed transaction but does not establish the price available for a new order.
- Historical yellow sheets communicated dealer bond quotations; they were not the same as current electronic trade reports or firm quotes.
- Execution reports and confirmations establish what actually traded.
What Market Data Includes
Market data is not one uniform dataset. It combines records created for different purposes:
| Data category | Common fields | What it can establish | Main limitation |
|---|---|---|---|
| Quote data | Bid, ask, quoted size, venue, condition | Displayed buying or selling interest | Interest can change and may cover limited size |
| Trade data | Price, quantity, execution time, venue, sale condition | A transaction was reported | The next trade can occur elsewhere or at another price |
| Depth data | Additional price levels and displayed size | Visible interest beyond the best prices | Hidden and off-venue liquidity may be absent |
| Reference data | Symbol, identifier, venue, currency, security status | Which instrument and market a record describes | Identifiers and status can change |
| Corporate-action data | Splits, dividends, mergers, symbol changes | Events needed to interpret a price series | Vendor timing and adjustment methods can differ |
| Summary data | Open, high, low, close, volume | Selected session or period observations | The methodology and eligible records matter |
| Derived data | Returns, ratios, indicators, rankings | A calculation based on market or issuer inputs | It is not a raw market event |
Comparing values without identifying their category creates avoidable errors. A quote, last sale, closing price, midpoint, and vendor fair-value estimate can all be labeled “price” while representing different evidence.
How Market Data Reaches a Screen
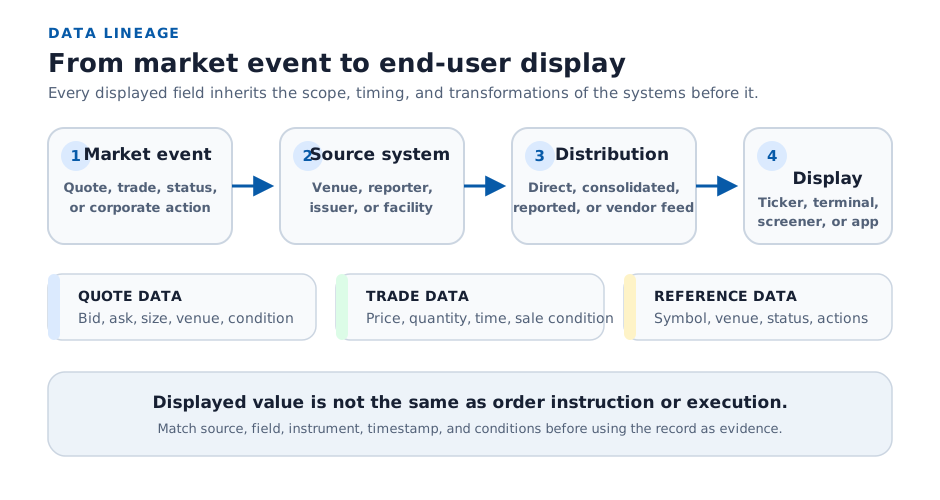
A simplified distribution chain has four stages:
- An order, quote update, execution, status change, or corporate action occurs.
- A venue, reporting facility, issuer, or other authorized source creates or receives a record.
- A direct feed, consolidated processor, reporting system, or vendor distributes and normalizes the data.
- A broker, website, terminal, ticker, screener, or internal system displays selected fields.
Delay and transformation can occur at every stage. The market event time, venue processing time, feed receipt time, vendor timestamp, and screen-render time are not necessarily identical.
For U.S. exchange-listed equities, public consolidated data and proprietary exchange feeds are different products. The SEC’s MIDAS materials explain that consolidated information does not show every order at every price level and that proprietary feeds can provide additional venue-specific data. This distinction matters when two systems appear to disagree.
Core Fields and Their Evidence
| Field | Example | Interpretation check |
|---|---|---|
| Symbol | XYZ | Confirm exchange, share class, and full identifier |
| Bid | $39.95 | Check source, size, venue coverage, and timestamp |
| Ask | $40.00 | Do not assume unlimited quantity is available |
| Last sale | $39.98 | Confirm trade time and sale condition |
| Trade size | 2,000 shares | Determine whether units and odd-lot treatment are understood |
| Volume | 1,250,000 shares | Identify session, venue, and consolidation methodology |
| Status | Halted | Check whether prices are reference values rather than active quotes |
| Delay label | Delayed | Use the data as an earlier market state, not a current quote |
For detailed equity quote timing, see Stock Quotes.
What Is a Stock Ticker?
A stock ticker is a symbol-based display of selected market information. It may show a ticker symbol, last price, price change, volume, status, or timestamp in a scrolling strip, watchlist, news broadcast, broker application, or terminal.
The term can be confused with a Ticker Symbol:
| Term | Meaning | Example |
|---|---|---|
| Ticker symbol | Short code used by a market or data service to identify a security | XYZ |
| Stock ticker | Display that combines a symbol with selected market fields | XYZ 42.15 +0.35 1.2M |
| Ticker tape | Time-ordered stream of trade, quote, or market updates | Repeated records for many symbols |
| Stock quote | Detailed current or recent bid, ask, size, last sale, and related fields | Order-ticket or quote-page display |
A symbol alone may not identify a security globally. The same letters can refer to different instruments on different venues, and suffixes can distinguish share classes, preferred shares, rights, warrants, or local listings.
Stock Ticker Example
Suppose a ticker displays:
1ABC 18.40 +0.25 750K
2DEF 52.10 -1.15 DELAYED
The first line communicates a symbol, displayed price, positive change, and volume. The second includes a delay warning. Neither line identifies the current bid, ask, available size, order type, or full security identity. It is monitoring information, not a complete execution instruction.
What Is Ticker Tape?
A ticker tape is a chronological stream of market updates. The term originated with paper produced by mechanical stock ticker machines; modern tape data is electronic and can contain trade reports, quote updates, or selected summary events.
A modern trade record can include:
- symbol and security identifier;
- reported price and quantity;
- execution or report timestamp;
- venue or reporting facility;
- sale condition or correction status; and
- sequence information used to order messages.
The data product controls what appears. A financial-news crawl may show only a symbol, last sale, and change, while a professional feed can expose timestamps, venues, conditions, cancellations, and corrections.
Ticker Tape Example
A record reading XYZ 50.10 2,000 10:31:04 may indicate that a trade for 2,000 shares at $50.10 was reported at the displayed time, subject to the feed’s definitions and conditions.
It does not mean:
$50.10remains available;- the trade occurred at the current best bid or offer;
- another order can execute for
2,000shares at that price; - the record was regular-session, on-time, or uncorrected; or
- the transaction is comparable to a much larger proposed order.
The Last Sale Price is historical transaction evidence. Current bid, ask, size, and depth are more relevant when evaluating a new order.
Consolidated, Direct, and Vendor Data
| Source type | What it generally represents | Main review question |
|---|---|---|
| Consolidated feed | Specified data combined across covered market participants or venues | Which markets, fields, and eligible records are included? |
| Direct venue feed | Data distributed by a particular exchange or venue | Is the analysis mistakenly treating one venue as the full market? |
| Reporting facility data | Reported transactions or quotations within the facility’s scope | What reporting rules, timing, and condition codes apply? |
| Vendor display | Data received, normalized, calculated, and presented by a service | Were fields renamed, rounded, delayed, adjusted, or cached? |
| Broker or terminal record | Market data presented alongside order and account functions | Is the value a quote field, order field, mark, or execution? |
Different data sources can be accurate within their own specifications and still show different values. A comparison should hold the instrument, field definition, market coverage, timestamp, currency, and adjustment method constant.
Real-Time, Delayed, End-of-Day, and Historical Data
| Timing state | Appropriate use | Main caution |
|---|---|---|
| Streaming real-time | Time-sensitive monitoring and order context | Processing, network, and display latency still exist |
| Snapshot real-time | Current value when requested | It can become stale after retrieval |
| Delayed | Education, general reference, and non-urgent review | It describes an earlier market state |
| End-of-day | Session summaries and periodic research | It is not intraday execution evidence |
| Historical | Backtesting, risk analysis, and performance review | Adjustments, survivorship, and missing records matter |
Historical series require special care. Split-adjusted prices can be suitable for return analysis but inappropriate when reconstructing the price printed on an old confirmation. A backtest can also be distorted if delisted securities, restated data, or information published after the test date is handled incorrectly.
What Were Yellow Sheets?
Yellow sheets were quotation publications associated with dealer indications for corporate bonds. The term is mainly historical today and should be understood as part of the evolution from printed or inter-dealer quotation media to electronic fixed-income data, dealer platforms, and transaction reporting.
Historical SEC-filed market materials describe yellow sheets as a bond-quotation component of the former National Quotation Service. That history does not make a yellow-sheet indication equivalent to a trade or a current firm quote.
Suppose an old bond file shows:
1ABC 5.25% due 2032: 98 bid / 99 offered
The record can provide historical dealer-market context. It does not prove that an investor could sell any quantity at 98 or buy any quantity at 99. A useful review would also identify:
- issuer, coupon, maturity, and security identifier;
- publication date and dealer source;
- whether the level was firm, indicative, or subject;
- quoted size or minimum denomination;
- price, yield, or spread convention;
- accrued-interest and settlement treatment; and
- later trades, quotes, or valuation evidence.
Modern fixed-income analysis may use FINRA data, transaction reports, dealer runs, request-for-quote records, and platform data. Each source still requires field, timing, and size checks.
Market Data for Trading, Research, and Valuation
The same data can be relevant to different decisions:
| Decision | Useful data | Additional evidence needed |
|---|---|---|
| Order entry | Current bid, ask, size, status, and depth | Order terms, route, controls, and execution response |
| Execution review | Quote history, trade reports, order timestamps | Order log, route events, fills, and cancellations |
| Security research | Historical prices, volume, issuer data, and filings | Business, financial-statement, valuation, and risk analysis |
| Portfolio valuation | Observable prices, quotes, comparable trades, reference data | Applicable valuation policy, liquidity analysis, and documented judgment |
| Risk monitoring | Positions, prices, volatility, liquidity, and correlations | Model definitions, limits, scenario assumptions, and data lineage |
Market data does not determine suitability or fair value by itself. A current quote can be relevant to execution while a documented valuation process requires additional evidence.
How to Evaluate Market Data
Before relying on a market-data record or display:
- Confirm the instrument. Match symbol, issuer, share class, venue, currency, and a durable identifier where available.
- Name the field. Distinguish bid, ask, last sale, midpoint, close, mark, model value, and adjusted price.
- Identify the source. Record the venue, reporting facility, consolidator, vendor, broker, or internal system.
- Check timing. Capture event time, receipt time, display time, time zone, delay status, and refresh method.
- Check coverage. Determine whether data is consolidated, venue-specific, top-of-book, depth-based, OTC, or partial.
- Read conditions. Review halt status, sale conditions, corrections, cancellations, and special indicators.
- Check transformations. Document currency conversion, rounding, corporate-action adjustment, and vendor calculations.
- Use final records for final claims. Use execution reports for fills, issuer records for corporate actions, and the applicable valuation records for financial reporting.
Common Mistakes
- Treating a ticker as full identity: symbols can change or differ by venue and share class.
- Calling every displayed number a quote: a ticker may show last sale, midpoint, close, or a vendor mark.
- Ignoring delayed-data labels: an accurate old observation is not a current market.
- Treating tape prints as executable prices: a completed trade does not guarantee the next fill.
- Ignoring condition codes: late, corrected, auction, or special-condition records may require different treatment.
- Mixing consolidated and venue-specific fields: the values can describe different market coverage.
- Combining adjusted and unadjusted history: this can invalidate comparisons and backtests.
- Using historical dealer indications as current liquidity: yellow-sheet or dealer-run evidence must be tied to date, source, size, and status.
Risks and Limitations
Market data can be incomplete, delayed, misidentified, corrected, or transformed. Outages, clock differences, feed gaps, corporate actions, and vendor logic can produce apparent discrepancies. Visible data also does not reveal every hidden order, bilateral indication, or source of liquidity.
Licensing and redistribution restrictions can apply to market data. Users should consult the applicable exchange, plan, vendor, or contract terms before storing or redistributing data.
This article is for financial education. It does not provide personalized investment, trading, valuation, legal, tax, licensing, or regulatory advice.
Sources and Further Reading
- SEC MIDAS: Market Information Data Analytics System compares consolidated data with more detailed proprietary exchange feeds.
- SEC: Modernizing Market Data Infrastructure describes U.S. regulatory changes concerning collection, consolidation, and dissemination of NMS market data.
- FINRA: Market Data Frequently Asked Questions explains fields and delay notices in FINRA’s investor market-data service.
- Consolidated Tape Association publishes information about the CTA/CQ plans and related data products.
- SEC public-comment archive: National Quotation Service description provides historical industry context for the former yellow-sheet quotation medium.
The regulatory and plan sources above describe U.S. markets. Other jurisdictions use different reporting systems, identifiers, and data rules.
FAQs
Is market data always real time?
Is a stock ticker the same as a ticker symbol?
Does ticker tape show the price available for my order?
Why can two market-data services disagree?
Are yellow sheets still the main source for corporate-bond prices?
Related Terms
- Ticker Symbol: Short identifier used within a market or data system.
- Market Quotes and Executable Prices: Bid, ask, last-sale, timing, depth, midpoint, dealer indications, and firm-quote evidence.
- Market Depth: Visible quantities across multiple price levels.
- Execution: Completed fill that records what actually traded.