Analytical Procedures
Analytical procedures compare recorded financial amounts with expectations built from plausible financial and nonfinancial relationships.
Analytical procedures evaluate financial information by comparing recorded amounts or ratios with expectations developed from plausible relationships among financial and nonfinancial data. Auditors use them to identify risks, obtain substantive evidence in suitable circumstances, and assess whether the financial statements make sense overall.
An unusual difference is not automatically an error or fraud. It is a signal that the expectation, recorded amount, underlying data, or business explanation requires more evidence.
Key Takeaways
- A valid analytical procedure starts with an expectation developed independently of the recorded amount being tested.
- The relationship must be plausible, predictable, and precise enough for the audit objective.
- Data reliability matters as much as mathematical sophistication.
- Auditors define an acceptable difference before comparing expected and recorded amounts.
- Management’s explanation should be corroborated with other evidence.
- Substantive analytics alone are usually insufficient for significant fraud risks.
- Investor ratio analysis resembles audit analytics but does not provide audit assurance.
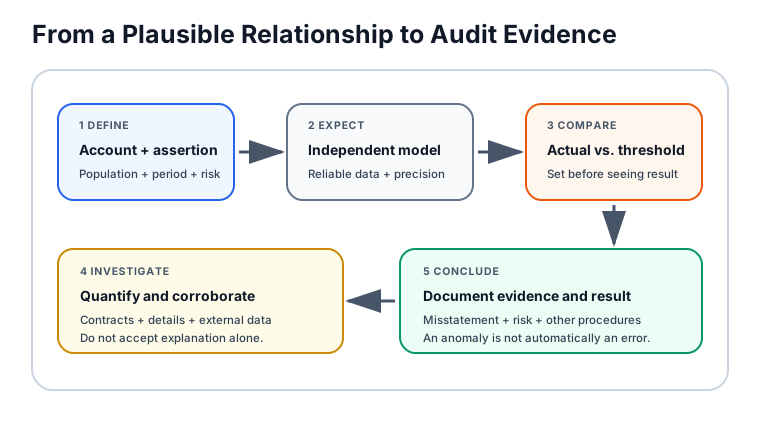
Three Uses in an Audit
| Audit stage | Purpose | Typical output |
|---|---|---|
| Risk assessment | Identify unusual relationships and areas that may be misstated | Revised risk assessment and planned procedures |
| Substantive testing | Obtain audit evidence about a specified assertion when the relationship is sufficiently predictable | Expected amount, acceptable difference, investigation, and conclusion |
| Overall review | Assess whether statements are consistent with the auditor’s understanding near completion | Additional questions or procedures before the report |
The same calculation can serve different purposes. Comparing monthly gross margins during planning may identify a high-risk product line. Using a precise quantity-times-price model as substantive evidence requires stronger data, a defined threshold, and documented follow-up.
Core Elements of a Substantive Analytical Procedure
1. Define the assertion
Identify the account, transaction class, period, and assertion being tested. Revenue occurrence, payroll completeness, and interest-expense accuracy require different relationships.
2. Develop an independent expectation
Use prior periods adjusted for known changes, approved budgets, industry information, contractual rates, operational quantities, headcount, floor area, production, or other relevant data. Simply repeating management’s reported number is not an independent expectation.
3. Assess predictability and data reliability
Fixed contractual interest may be highly predictable. Advertising expense or litigation provisions may not be. Data should come from reliable sources, use consistent definitions, cover the right period, and be tested when necessary.
4. Set precision and an acceptable difference
The expectation must be precise enough to identify a misstatement that could matter. The auditor determines how large a difference can be accepted without further investigation, considering materiality and desired assurance.
5. Compare and investigate
Calculate the difference, obtain explanations, and corroborate them through contracts, invoices, operational reports, third-party data, tests of details, or other evidence. An explanation such as “business growth” is not sufficient unless the amount and timing reconcile.
6. Conclude and document
Record the expectation, assumptions, source data, threshold, result, additional procedures, evidence, and effect on the audit conclusion.
Common Analytical Methods
| Method | Example | Main limitation |
|---|---|---|
| Trend analysis | Monthly revenue compared with prior periods | Structural changes can break the historical relationship |
| Ratio analysis | Gross margin, receivable days, or payroll per employee | Ratios can hide offsetting errors |
| Reasonableness test | Units sold multiplied by average price | Requires reliable, compatible operational data |
| Regression or statistical model | Expense estimated from several cost drivers | Complexity does not repair biased or incomplete data |
| Disaggregation | Analysis by month, location, product, or customer | More detail can introduce noisy or inconsistent data |
| Peer comparison | Margin compared with similar companies | Accounting policy, mix, geography, and scale can differ |
Disaggregated, operationally grounded expectations are often more precise than one annual comparison.
Worked Example: Hotel Room Revenue
An auditor tests room revenue for a hotel with 200 available rooms. Reliable operating records show average occupancy of 72% and an average daily room rate of USD 150 for a 365-day year.
The independent expectation is:
The general ledger reports USD 8,250,000. The difference is:
If the auditor’s predefined acceptable difference is USD 150,000, the USD 366,000 variance requires investigation. Possible explanations include:
- resort fees or other revenue incorrectly included in room revenue;
- occupancy or rate data using a different population;
- complimentary rooms included inconsistently;
- foreign-exchange or tax treatment;
- unrecorded room availability changes;
- duplicate or fictitious revenue; or
- an error in the expectation.
Suppose contracts and folio data show that USD 340,000 of separately recorded room-upgrade charges were omitted from the operational average rate. The auditor updates the expectation only after verifying those charges and then investigates the remaining difference. Accepting management’s verbal explanation without corroboration would not complete the procedure.
What Makes an Expectation Precise
- Stable relationship: The driver has behaved consistently or changes can be modeled.
- Appropriate disaggregation: Monthly or location-level data can reveal differences hidden in annual totals.
- Compatible definitions: Financial and operational data cover the same products, entities, dates, currency, and gross-or-net basis.
- Independent source: The input is not generated by the same process that produced the amount under audit without further testing.
- Limited estimation range: The model can distinguish an unacceptable misstatement from normal variation.
- Documented assumptions: Price, volume, mix, seasonality, and exceptional events are explicit.
A model can be mathematically exact but evidentially weak if its inputs are incomplete or controlled by the same person who recorded the account.
Reliability of Financial and Nonfinancial Data
Auditors consider where data came from, who can change it, which controls apply, whether it reconciles to source records, and whether definitions remained consistent. For example, payroll expense estimated from headcount is weak if the headcount file excludes contractors while payroll includes them.
External data can also be unreliable or mismatched. An industry growth rate may cover a different geography, customer segment, currency, or accounting period. Source prestige does not guarantee relevance.
Responding to Unexpected Differences
- Recheck the calculation, population, units, and period.
- Challenge the expectation and each assumption.
- Obtain management’s explanation at the level needed to quantify the variance.
- Corroborate the explanation with independent evidence.
- Perform tests of details or other procedures for unresolved amounts.
- Reassess fraud risk, control reliance, and other accounts affected by the explanation.
- Evaluate identified misstatements individually and in aggregate.
An unexplained difference can indicate higher risk even when it is not ultimately recorded as a misstatement.
Analytical Procedures and Fraud Risk
Manipulation can preserve an expected ratio. For example, fictitious revenue and receivables can rise together, leaving receivable turnover deceptively stable. Management override can also create artificial relationships designed to pass a high-level test.
For significant fraud risks, use analytics to target transactions and locations, then obtain detailed evidence. Journal entries, contracts, confirmations, delivery, cash, communications, access logs, and subsequent events may be necessary.
Investor Analysis vs. Audit Evidence
Investors use trend, ratio, and peer analysis to assess performance and risk. They usually lack the source records, control testing, confirmations, materiality framework, and access available to an auditor. Therefore, an investor screen can support a question or valuation adjustment but should not be described as an audit conclusion.
Common Mistakes
Comparing actual results only with budget. A budget may contain the same bias or outdated assumptions as management’s reporting.
Choosing a threshold after seeing the result. This creates hindsight bias and weakens the test.
Accepting a plausible story without quantification. The explanation must account for the amount and timing of the difference.
Using ratios without underlying amounts. Two offsetting misstatements can leave a ratio unchanged.
Assuming more data means better evidence. Incomplete, duplicated, or uncontrolled data can make a complex model less reliable.
Treating an anomaly as fraud. An anomaly is a lead; intent and material misstatement require separate evidence.
Official Sources
- PCAOB: AS 2305, Substantive Analytical Procedures sets requirements for expectations, plausibility, precision, investigation, corroboration, and documentation.
- PCAOB: AS 2110, Identifying and Assessing Risks of Material Misstatement addresses analytical procedures used in audit risk assessment.
- PCAOB: AS 2810, Evaluating Audit Results covers overall review and evaluation of identified misstatements.
- PCAOB: AS 1105, Audit Evidence explains sufficiency, appropriateness, relevance, and reliability of audit evidence.
Related Terms
- Material Misstatement: A misstatement that could reasonably affect user decisions under the relevant framework.
- Materiality: The context-specific significance of information or error to financial-statement users.
- Financial Statements: The primary statements and notes evaluated in a financial-statement audit.
- Accounting Ratio: A relationship between financial amounts used for comparison and interpretation.
- Financial Statement Fraud: Intentional material misstatement or omission designed to deceive users.
- Internal Control: Processes that support reliable reporting and affect data reliability.
FAQs
What is the purpose of an analytical procedure?
Is ratio analysis an analytical procedure?
Can analytical procedures detect fraud?
What happens when actual results differ from the expectation?
This article provides general audit and financial-analysis education, not audit, accounting, forensic, legal, or investment advice. Audit conclusions require qualified professionals, sufficient appropriate evidence, and the standards applicable to the engagement.