Inverted Yield Curve
Yield-curve shape in which shorter maturities yield more than longer maturities, often interpreted as a slowdown warning.
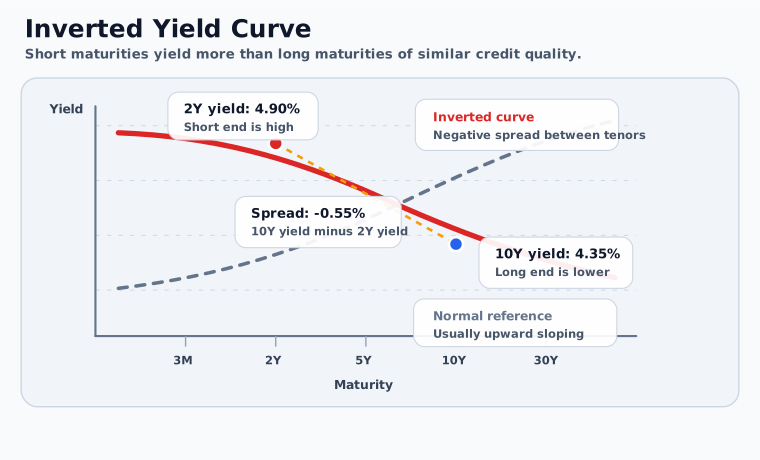
An inverted yield curve occurs when shorter-maturity debt yields more than longer-maturity debt of similar credit quality. In practice, the phrase usually refers to Treasury-market spreads such as the 10-year yield minus the 2-year yield or the 10-year yield minus the 3-month Treasury bill yield.
Key Takeaways
- An inverted curve is a relative-maturity signal, not a prediction by itself.
- The spread is usually calculated as
longer-maturity yield - shorter-maturity yield; a negative result shows inversion. - Analysts should pair the curve signal with credit spreads, inflation data, policy expectations, and the specific cash-flow decision being made.
- The relevant maturity pair, observation date, source, and curve construction method must be documented before the signal is used in valuation or risk work.
Why It Matters
An inversion often appears when the short end of the curve is high because monetary policy is tight, while longer yields are lower because investors expect slower growth, lower future inflation, future rate cuts, or stronger demand for longer-duration safety. That makes the signal important for fixed-income portfolios, bank funding, credit analysis, corporate treasury, and valuation scenarios.
It does not guarantee a recession or a specific market return. The curve can stay inverted for a long time, reinvert after briefly normalizing, or send a noisy signal if one maturity point is distorted by liquidity, bill supply, flight-to-quality demand, or technical positioning.
Worked Example: 2-Year/10-Year Inversion
The basic spread calculation is:
1Longer-maturity yield - shorter-maturity yield = curve spread
If the 2-year Treasury yield is 4.90% and the 10-year Treasury yield is 4.35%, then:
110-year yield - 2-year yield = 4.35% - 4.90% = -0.55%
The spread is negative 55 basis points, so the curve is inverted between those two maturities.
Common Inversion Measures
| Spread | What it compares | Why analysts watch it |
|---|---|---|
| 10-year minus 2-year Treasury yield | Intermediate policy-sensitive maturity versus long benchmark maturity | Common market shorthand for curve inversion and cycle risk. |
| 10-year minus 3-month Treasury yield | Long maturity versus very short Treasury bill rate | Often used in macro and recession-risk research because it captures the current short-rate stance. |
| 30-year minus 5-year Treasury yield | Long end versus the belly of the curve | Useful for duration positioning, liability matching, and curve-shape trades. |
Where It Changes Finance Decisions
| Decision area | Practical question |
|---|---|
| Bond portfolios | Should duration, cash allocation, barbell exposure, or roll-down assumptions change? |
| Banks and lenders | Are deposit costs, wholesale funding costs, and asset yields compressing net interest margins? |
| Corporate treasury | Does the curve change the tradeoff between short-term borrowing, long-term issuance, refinancing, or waiting? |
| Valuation | Should discount-rate scenarios, terminal-rate assumptions, or recession cases be revisited? |
| Credit analysis | Do refinancing risk, delinquency trends, leverage, and credit spreads confirm or contradict the curve signal? |
Common Mistakes
- Treating inversion as a guaranteed recession clock.
- Comparing one country’s curve with another without stating issuer, currency, and maturity points.
- Using today’s headline curve when the analysis requires the curve on a valuation date, reporting date, or contract reset date.
- Ignoring whether the curve uses par yields, constant-maturity yields, spot rates, forward rates, or market quotes.
- Drawing a macro conclusion without connecting it to a cash-flow, funding, risk, or portfolio decision.
Source Checks
Use source data before relying on a curve-inversion claim:
- U.S. Treasury interest rate statistics: Official Treasury curve and rate publication pages.
- Federal Reserve H.15 selected interest rates: Federal Reserve release for selected market interest-rate series.
- FRED 10-year minus 2-year Treasury spread: Ready-made 10-year minus 2-year spread series.
- FRED 10-year minus 3-month Treasury spread: Ready-made 10-year minus 3-month spread series.
For decision-grade work, record the data source, observation date, maturity pair, spread calculation, and whether the analysis uses nominal, real, par, spot, or forward rates.
FAQs
Why is an inverted yield curve treated as a recession warning?
Can the yield curve stay inverted for a long time?
Does inversion mean all yields are low?
Related Terms
- Yield Curve: The broader maturity structure that includes normal, flat, inverted, and humped shapes.
- Normal Yield Curve: The usual upward-sloping alternative.
- Flat Yield Curve: A transitional shape that may precede or follow inversion.
- Par Yield Curve: A curve built from par yields across maturities.
- Term Premium: Extra compensation investors may require for longer maturity exposure.
- Fed Funds Rate: Central-bank policy rate that strongly affects the short end of the curve.
- Interest Rate Risk: The broader risk that rate changes alter bond prices, funding costs, and valuation.