Price-to-Earnings Ratio
The price-to-earnings ratio compares a company's share price with earnings per share for equity valuation.
The price-to-earnings ratio, or P/E ratio, compares a company’s share price with its earnings per share.
In plain language, it tells you how many dollars investors are willing to pay for one dollar of current or expected earnings.
Why the P/E Ratio Matters
P/E matters because it is one of the fastest ways to connect a stock price to business performance.
Investors use it to ask questions such as:
- Is the stock priced richly relative to current earnings?
- Is the market paying up because growth is expected?
- Is the stock cheap for a good reason, such as weak quality or shrinking profits?
P/E does not answer those questions by itself, but it is often where the conversation starts.
How It Works in Finance Practice
The basic version is:
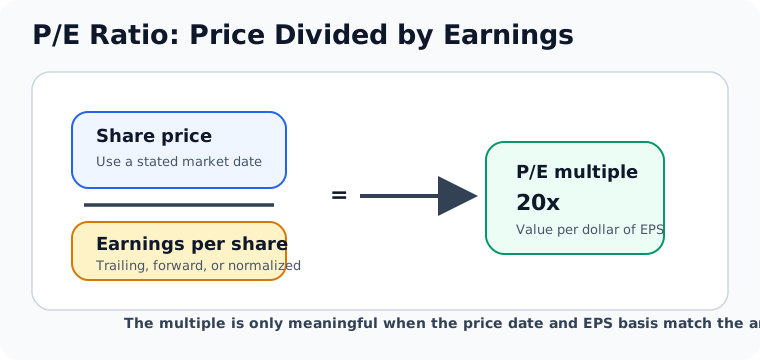
If a stock trades at $60 and earns $3 per share, the P/E ratio is:
That means investors are paying 20x earnings.
In practice, analysts usually care about the context around the number:
- trailing P/E uses past earnings
- forward P/E uses expected earnings
- sector norms matter
- earnings quality matters
A high P/E is not automatically bad. It may reflect expected growth or unusually durable profits. A low P/E is not automatically attractive if the earnings base is weak or deteriorating.
What Analysts Need To Define
The numerator and denominator must be measured consistently:
| Input | What To Check | Why It Matters |
|---|---|---|
| Share price | Price date, intraday versus closing price, currency, and share class | A stale or mismatched price can distort the multiple |
| EPS basis | Basic, diluted, adjusted, GAAP, IFRS, continuing operations, or normalized EPS | Different EPS definitions can produce very different P/E ratios |
| Time period | Trailing twelve months, last fiscal year, next fiscal year, or normalized cycle earnings | Cyclical companies can screen cheap at peak earnings and expensive at trough earnings |
| Share count | Basic shares, diluted shares, buybacks, option dilution, and dual-class structures | Per-share metrics depend on the denominator as well as net income |
| Peer set | Sector, growth, margins, leverage, accounting policy, and capital intensity | P/E is most useful when earnings quality and business economics are comparable |
Public Source Checks
Use public filings and structured data before relying on a headline P/E:
- SEC EDGAR Company Search: Filings for EPS, share-count notes, earnings quality, segment changes, risk factors, buybacks, and management discussion.
- SEC Financial Statement Data Sets: Structured historical statement data for net income, shares, EPS, and related checks.
- SEC Company Facts API: Company-level XBRL facts that can help verify reported EPS and share-count line items.
- Company earnings releases and reconciliations: useful for adjusted EPS, but the adjustments should be tied back to reported earnings.
Market data should be measured on the same date as the price input. Earnings data should be labeled by period and basis, especially when comparing trailing P/E with forward P/E.
P/E vs. Other Common Equity Multiples
| Multiple | Denominator | Works best when | Main weakness |
|---|---|---|---|
| P/E | Earnings per share | Earnings are positive, reasonably stable, and economically meaningful | Breaks down when earnings are negative, cyclical, or distorted |
| Price-to-Book Ratio | Book value per share | Book equity is meaningful, especially in financials and asset-heavy sectors | Misses much of the economics in intangible-heavy businesses |
| Price-to-Cash-Flow Ratio | Cash flow per share | Investors want a cash-based cross-check on earnings quality | Period cash flow can still be noisy because of working-capital swings |
That comparison is why analysts rarely stop at a headline P/E. They use P/E when earnings are a fair proxy for business performance, then cross-check it with book-value and cash-flow multiples when accounting or industry context makes the earnings figure less reliable.
When P/E Misleads
P/E can mislead when:
- earnings are negative, tiny, or temporarily inflated
- restructuring charges, gains, tax effects, or one-time items distort EPS
- leverage differs sharply across peers
- accounting policy changes affect reported profit
- buybacks change EPS without improving operating performance
- growth expectations are embedded in the price but not visible in trailing earnings
- cyclical earnings are above or below normalized levels
In those cases, cross-check P/E with free cash flow, EV/EBITDA, price-to-sales, return on invested capital, leverage, and earnings-quality analysis.
Practical Review
When reviewing Price-to-Earnings Ratio, ask where it enters the analysis: peer screen, target multiple, valuation range, earnings normalization, recommendation, or sensitivity case. If it changes equity value, implied price, relative-value ranking, or margin of safety, show the bridge explicitly.
Review Checklist
Before relying on P/E, document:
- the price date and market source
- whether EPS is trailing, forward, normalized, basic, diluted, reported, or adjusted
- the reconciliation from adjusted EPS to reported EPS when adjustments are used
- the peer set and why each company is comparable
- growth, margin, leverage, and accounting differences across peers
- whether earnings are cyclical, one-time, tax-affected, or capital-structure distorted
- the valuation conclusion that changes if the multiple changes
If those checks are missing, keep the P/E discussion descriptive instead of treating it as final valuation support.
Related Terms
- Market Capitalization: The total equity value the market assigns to the company.
- Earnings Per Share: The denominator in the P/E ratio.
- Price-to-Book Ratio: Another common valuation multiple, especially in asset-heavy sectors.
- Free Cash Flow: A reality check when accounting earnings and cash generation diverge.
- Enterprise Value: A broader valuation measure that includes debt as well as equity.