Correlation
Correlation standardizes the linear co-movement between two variables and helps analysts assess diversification, factor exposure, and changing financial relationships.
Correlation measures the direction and strength of the linear relationship between two variables on a standardized scale from -1 to +1. In finance, analysts commonly calculate correlation between asset returns, risk factors, interest-rate changes, credit spreads, or operating metrics.
A high correlation does not prove that one variable causes the other, and a low correlation does not prove independence. Correlation is a sample estimate that can change with the measurement period, frequency, market regime, and data treatment.
Key Takeaways
- Correlation of +1 indicates a perfect positive linear relationship; -1 indicates a perfect negative linear relationship; 0 indicates no linear relationship.
- Portfolio diversification depends on correlations being below +1, but lower correlation does not make an asset safe or attractive by itself.
- Correlation is covariance divided by the two variables’ standard deviations, which makes it unitless and comparable across pairs.
- The result can be distorted by outliers, nonlinear relationships, stale prices, mismatched frequencies, and a short or unrepresentative sample.
- Correlations are not fixed and may change sharply during stressed markets.
- Use rolling estimates, scenarios, and economic reasoning rather than relying on one full-sample coefficient.
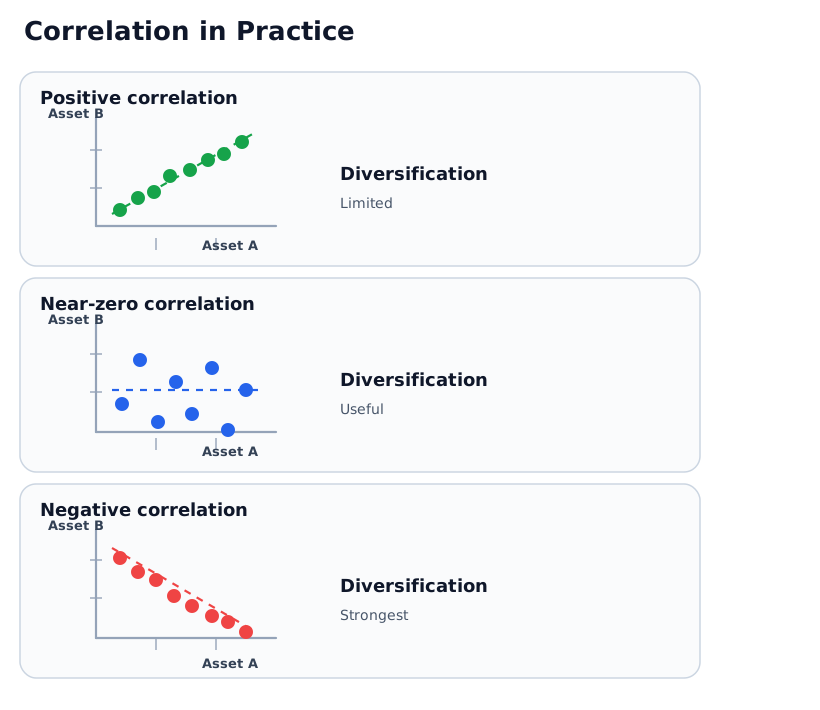
Correlation describes the linear pattern of co-movement. A tighter upward or downward pattern indicates a stronger linear relationship.
Interpreting the Correlation Coefficient
| Correlation | Linear relationship | Portfolio interpretation |
|---|---|---|
| +1.0 | Perfect positive | No variance reduction from combining the two assets at fixed volatilities |
| Between 0 and +1 | Positive | Some diversification may exist, but returns tend to move in the same direction |
| Near 0 | Little linear relationship | Potential diversification, although nonlinear or stress dependence may remain |
| Between -1 and 0 | Negative | One return series tends to offset part of the other’s movement |
| -1.0 | Perfect negative | A particular weight combination can theoretically eliminate variance if the relationship persists |
Terms such as “high” or “low” are context-dependent. A correlation of 0.60 may be high for some asset classes and low for two funds following similar mandates. The coefficient does not show the size of each asset’s volatility or expected loss.
Correlation Formula
For variables (X) and (Y), the population correlation is:
For a sample, analysts estimate covariance and standard deviation from observed data. Because the denominator scales the covariance, correlation has no unit and remains between -1 and +1 when calculated consistently.
Correlation is undefined if either variable has zero variance. It can also be misleading when return observations are not aligned, one market is closed while another is open, or illiquid prices remain unchanged for several periods.
Worked Example: Correlation and Portfolio Volatility
Assume a portfolio invests 60% in Asset A and 40% in Asset B. Asset A has estimated annual volatility of 20%, and Asset B has estimated annual volatility of 10%. Two-asset portfolio variance is:
Holding weights and individual volatilities constant, the estimated portfolio volatility changes with correlation:
| Assumed correlation | Portfolio variance | Portfolio volatility |
|---|---|---|
| +0.80 | 0.02368 | 15.39% |
| 0.00 | 0.01600 | 12.65% |
| -0.50 | 0.01120 | 10.58% |
The lower-correlation combinations have lower modeled volatility, but the example is not an investment recommendation. Expected return, liquidity, credit quality, fees, taxes, tail losses, and whether the estimated relationship will persist also matter.
How Correlation Is Used in Finance
Portfolio Construction
Correlation helps estimate how holdings interact inside a portfolio. Owning two different securities does not provide much diversification if both are driven by the same underlying factor and move almost identically.
Factor and Hedge Analysis
Analysts compare returns with equity indexes, rates, currencies, commodities, or style factors to identify possible exposures. A stable economic hedge should be evaluated under the conditions in which protection is needed, not only over an average historical period.
Risk Aggregation
Market, credit, and asset-liability models often use correlation matrices to combine exposures. Small changes across many pairwise assumptions can materially change a portfolio or enterprise risk estimate.
Business and Valuation Analysis
Analysts may examine relationships between revenue and economic activity, margins and input prices, or valuation multiples and growth. These relationships can support a hypothesis, but they do not establish a causal mechanism.
Pearson, Rank, and Rolling Correlation
| Measure | What it captures | Limitation |
|---|---|---|
| Pearson correlation | Linear relationship between numerical variables | Sensitive to outliers and can miss nonlinear dependence |
| Spearman rank correlation | Monotonic relationship using ranks | Discards information about the size of differences |
| Rolling correlation | Estimate over a moving window | Highly dependent on window length and can be noisy |
| Conditional correlation | Relationship under specified states or model conditions | Depends on how the conditions and model are defined |
Selecting a different coefficient does not solve weak data or an unstable economic relationship. The method should match the question and variable properties.
Why Correlation Changes
Estimated correlation can shift because:
- economic drivers or business models change
- leverage, hedging, or portfolio composition changes
- volatility rises unevenly across assets
- liquidity deteriorates and market prices gap together
- monetary, fiscal, or regulatory regimes change
- the sample window adds or removes a crisis period
- data frequency, currency, or return definitions change
During market stress, assets exposed to common funding or liquidity pressures may become more positively correlated. This does not happen uniformly, and a historical crisis estimate may not describe the next stress event.
Common Mistakes
- Treating correlation as causation: a common driver, reverse causality, or coincidence may explain the relationship.
- Using price levels instead of returns: trending prices can produce a high correlation that does not describe return co-movement.
- Mixing frequencies: comparing daily data with weekly or monthly observations without careful alignment.
- Ignoring stale prices: illiquid assets may appear artificially stable or weakly correlated.
- Choosing a favorable window: changing start and end dates can materially alter the estimate.
- Assuming zero means independent: variables can have nonlinear dependence even when linear correlation is zero.
- Ignoring estimation uncertainty: a coefficient calculated from a small sample can be unstable.
- Using one normal-period estimate for stress risk: dependence can change precisely when diversification is needed.
How to Evaluate a Correlation Estimate
- Confirm the variables, units, currency, frequency, and observation timestamps.
- Use returns or changes when levels are nonstationary or trending.
- Plot the data and inspect outliers before relying on the coefficient.
- Compare full-sample and rolling estimates across meaningful regimes.
- Test alternative frequencies and reasonable sample windows.
- Evaluate economic mechanisms and common risk factors.
- Use stress scenarios for relationships that matter during adverse markets.
- Document how the estimate affects the portfolio, hedge, model, or decision.
Authoritative Sources
- NIST Statistical Glossary: Correlation: definition and interpretation of the Pearson correlation coefficient.
- NIST Dataplot: Correlation: formula and statistical implementation notes.
- NIST: Experiments and Experimental Design: distinction between correlation and causal relationships.
Related Terms
- Covariance: Unscaled measure of how two variables vary together.
- Portfolio Variance: Portfolio risk measure that combines weights, variances, and covariances.
- Standard Deviation: Dispersion measure used to scale covariance into correlation.
- Diversification: Combining exposures to reduce concentration in common outcomes.
- Regression Analysis: Method for estimating a conditional relationship between an outcome and explanatory variables.
- Cointegration: Long-run relationship concept for nonstationary time series.
FAQs
Is negative correlation always better?
Can correlation change over time?
Does zero correlation mean two variables are independent?
This article provides general financial education. Historical correlation does not guarantee future diversification or protection and is not personalized investment or risk-management advice.