Support and Resistance: Meaning, Zones, and Breakouts
Support and resistance are price zones where buying or selling previously slowed a market move, often used to frame ranges and breakouts.
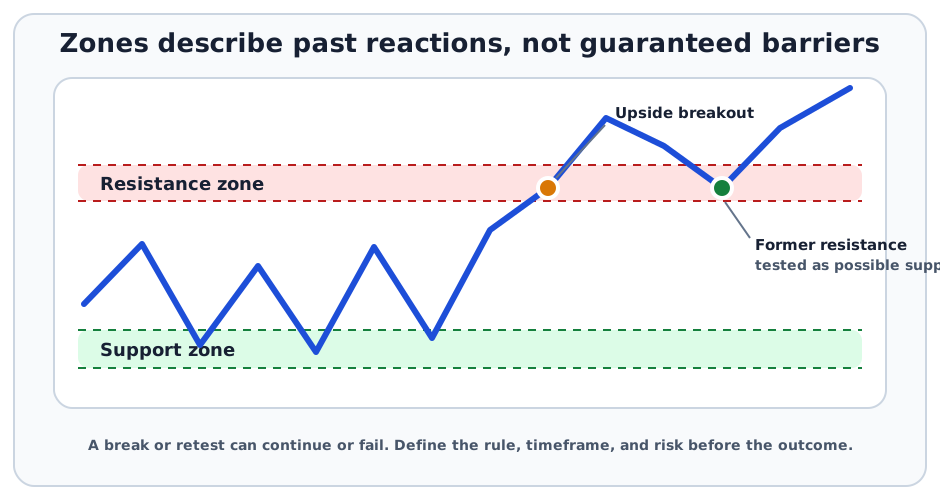
Support and resistance are price zones where buying or selling activity has previously slowed, stopped, or reversed a market move. Support is the lower area where buyers have appeared during declines; resistance is the upper area where sellers have appeared during advances.
These zones summarize past price behavior. They do not guarantee that buyers or sellers will return, and they do not establish an asset’s fair value.
Key Takeaways
- Support describes a lower price area where declines have previously slowed or reversed.
- Resistance describes an upper price area where advances have previously slowed or reversed.
- Both are usually zones rather than exact prices.
- Price can break through a zone, reverse after crossing it, or gap past it without trading at the marked level.
- A former resistance area may become support after an upside breakout, while broken support may later become resistance.
- A chart level becomes decision-relevant only when it is tied to a timeframe, order rule, position size, and maximum loss.
Support vs. Resistance
| Concept | What the chart shows | Common use | Main limitation |
|---|---|---|---|
| Support | Buying previously appeared during a decline | Lower range boundary, pullback review, or downside-break level | Demand can disappear |
| Resistance | Selling previously appeared during an advance | Upper range boundary, profit-taking context, or upside-break level | Supply can be absorbed |
| Support becomes resistance | Price breaks lower and later rallies back toward the old zone | Reviewing a failed recovery | The old level may no longer matter |
| Resistance becomes support | Price breaks higher and later pulls back toward the old zone | Reviewing a breakout retest | The retest can fail |
The words “support level” and “resistance level” commonly refer to these same zones. The word “level” does not mean the market must react at one exact price.
How Support and Resistance Form
Support and resistance are interpretations of trading behavior, not physical barriers. Several mechanisms may make an area visible on a chart:
- Prior turning points: Traders can see where earlier advances or declines changed direction.
- Resting and conditional orders: Limit, stop, and profit-taking orders may cluster around familiar prices.
- Position memory: Participants who previously bought or sold near a level may react when price returns.
- Round numbers: Prices such as
50or100can attract attention because they are easy reference points. - Range boundaries: Repeated movement between a lower and upper zone makes both areas visible.
- Changing information: Earnings, economic data, news, or a liquidity shock can invalidate the old behavior immediately.
Observed reactions do not reveal every participant’s motive. A chart cannot show whether a trade was speculative, a hedge, a forced liquidation, an index rebalance, or part of a larger portfolio.
Common Types of Levels
| Type | How it is identified | What to document |
|---|---|---|
| Horizontal zone | Repeated highs or lows near similar prices | Zone width, number of reactions, and timeframe |
| Prior high or low | A visible swing extreme | Date, session, and whether the price was adjusted |
| Trend Line | Sloped line through selected highs or lows | Which points were used and why |
| Moving Average | Average price over a rolling window | Price field, period, and calculation method |
| Opening Range | Early-session high and low | Session definition, timezone, and duration |
| Volume area | Price region with unusually high past activity | Volume source and aggregation method |
Different methods can identify different zones on the same chart. The analyst should explain the method instead of presenting a line as self-evident.
Role Reversal After a Break
Traders often say that resistance becomes support after price breaks above it. The idea is that a later pullback may attract buyers near the old resistance area. The reverse can occur when broken support caps a later rebound.
Role reversal is an observation to test, not a market law. It is weaker when:
- the original zone had few or inconsistent reactions;
- price crossed the zone only briefly;
- the breakout occurred in thin trading;
- a corporate action changed the historical price series; or
- important information changed the asset’s expected value.
How to Evaluate a Zone
Define the timeframe
An intraday support area can coexist with a weekly downtrend. State whether the level comes from minute, daily, weekly, or another data interval.
Mark a zone before the outcome
Record the upper and lower boundary before deciding whether a test succeeded. Moving a line after every price change makes the analysis difficult to reproduce.
Check the data
Confirm the venue, timezone, regular or extended trading hours, and treatment of splits, distributions, contract rolls, or missing observations. A stale or unadjusted series can place a level at the wrong price.
Review participation and liquidity
Trading Volume can show activity near a zone, but volume does not prove future buying or selling. Also review the Bid-Ask Spread, available depth, and likely market impact.
Define invalidation and execution
Specify what counts as a break and what action follows. A stop order can execute away from its trigger in a fast market, while a limit order may not execute at all. The chart level and the actual fill are different records.
Support and Resistance vs. Nearby Terms
| Term | Meaning | Difference |
|---|---|---|
| Support and resistance | Market behavior observed around price zones | The concept being analyzed |
| Horizontal Line | Drawing at a constant price | A visual tool used to mark a zone |
| Breakout | Price movement beyond a defined boundary | An event relative to the zone |
| Pullback | Temporary move against a prevailing trend | May test a zone without changing the broader trend |
| Stop price | Trigger specified in an order instruction | An executable instruction, not proof of support |
| Fair value | Estimate based on cash flows, comparables, or another valuation method | Economic estimate rather than a chart reaction area |
Risks and Limitations
- False-break risk: Price may cross a zone and quickly return.
- Gap risk: New information can move price beyond a level before an order can execute near it.
- Timeframe conflict: A level can appear strong on one interval and insignificant on another.
- Selection bias: Analysts can draw many levels and emphasize only those that later appear accurate.
- Liquidity risk: A visually clear level may be difficult to trade when spreads widen or depth disappears.
- Corporate-action risk: Splits, distributions, mergers, and futures rolls can alter historical price comparisons.
- Valuation gap: Technical support does not establish that an asset is inexpensive, solvent, or suitable.
Common Mistakes
- Treating a zone as a guaranteed floor or ceiling.
- Drawing a level from one isolated price without explaining why it matters.
- Moving the zone after the outcome to preserve the original interpretation.
- Mixing intraday, closing, adjusted, and unadjusted prices.
- Assuming higher volume confirms direction rather than simply showing more activity.
- Placing a stop directly at an obvious level without considering volatility and execution.
- Calling every move through a line a valid breakout.
Public Source Checks
Investor.gov defines support and resistance as technical-analysis price levels associated with concentrated demand or supply. The CFTC Futures Glossary defines support and resistance in futures-market terminology. Investor.gov also explains why order types and trade execution can produce results different from a marked chart price.
Related Terms
- Technical Analysis: Broader discipline that uses price and market data.
- Horizontal Line: Tool for marking constant-price zones.
- Breakout: Move beyond support, resistance, or another boundary.
- Opening Range: Early-session high-low band that may become an intraday reference zone.
- Market Trend: Persistent directional structure over a stated timeframe.
FAQs
Are support and resistance exact prices?
What happens when support or resistance breaks?
Can the same area be both support and resistance?
Does support mean a security is undervalued?
Educational Use
This article is for financial education only. It does not provide personalized investment, trading, tax, or legal advice and does not recommend any security, chart level, order, or strategy.