Beta
Beta estimates how sensitive an investment's returns have been to a selected market benchmark, but it does not measure total investment risk.
Beta estimates how sensitive an asset or portfolio’s returns have been to movements in a selected market benchmark. A beta of 1.2 means the fitted relationship has historically associated a 1% benchmark move with an approximately 1.2% move in the asset, before considering the model’s intercept and residual return.
Beta is a relative measure of market exposure, not a forecast, a measure of maximum loss, or a complete measure of investment risk.
Key Takeaways
- Beta is the covariance of an asset’s returns with benchmark returns divided by the variance of benchmark returns.
- The benchmark, return frequency, lookback window, currency, and estimation method can materially change the result.
- Beta measures fitted sensitivity to one selected factor. It does not capture all company-specific, liquidity, credit, valuation, or tail risk.
- A beta above 1 indicates greater estimated sensitivity than the benchmark; it does not guarantee outperformance or a specific future move.
- Beta is commonly used in portfolio analysis and the capital asset pricing model (CAPM).
Beta Formula
For asset \(i\) and benchmark \(m\):
where:
- \(R_i\) is the asset’s periodic return
- \(R_m\) is the benchmark’s periodic return
- covariance measures how the two return series move together
- benchmark variance scales that co-movement by the benchmark’s own dispersion
In a single-factor return regression, beta is the fitted slope:
Analysts may use total returns or excess returns depending on the model. The method, benchmark, and return definition should be stated.
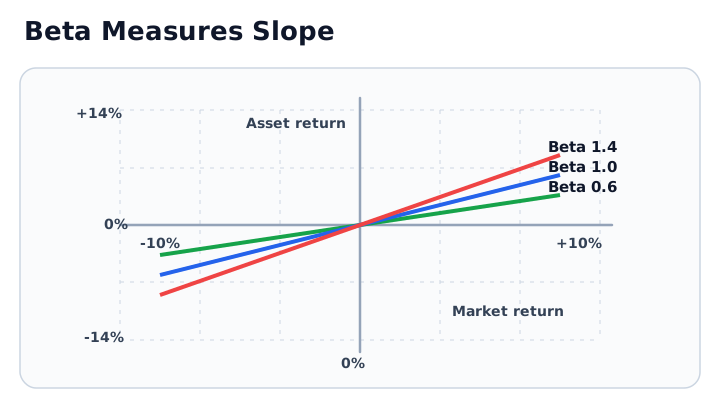
A steeper fitted slope indicates greater estimated sensitivity to the selected benchmark.
How to Interpret Beta
| Estimated beta | Typical interpretation |
|---|---|
| Above 1 | The asset has shown amplified sensitivity to benchmark moves |
| Near 1 | The asset has shown sensitivity broadly similar to the benchmark |
| Between 0 and 1 | The asset has tended to move in the benchmark’s direction, but by less |
| Near 0 | The fitted linear relationship shows little benchmark sensitivity |
| Below 0 | The asset has tended to move opposite the benchmark in the sample |
These are model interpretations, not promises. A beta near zero can coexist with substantial standalone volatility, and a negative estimate may be unstable or specific to one period.
Worked Example
Assume a stock has an estimated beta of 1.3 relative to a broad equity index. If the index rises 2%, the beta component of the fitted model is:
This does not predict that the stock will rise exactly 2.6%. Its realized return also reflects the intercept, company-specific information, estimation error, and risks not represented by the selected benchmark.
The same caution applies in a falling market. Beta describes a symmetric linear exposure unless the analyst models different up-market and down-market behavior.
Beta, Correlation, and Total Volatility
Beta and correlation are related but answer different questions:
A high beta can result from high correlation, high asset volatility relative to the benchmark, or both.
| Measure | What it describes | What it does not show |
|---|---|---|
| Beta | Fitted sensitivity to a selected benchmark | Total standalone risk |
| Correlation | Direction and strength of standardized co-movement | Relative move size |
| Standard deviation | Total return dispersion in the sample | Source of that dispersion |
| R-squared | Share of sample variation explained by the fitted model | Whether beta will remain stable |
| Alpha | Regression intercept or model-relative return estimate | A guaranteed skill or future excess return |
Beta should be read with the regression’s R-squared, standard error, sample period, and residual analysis. A precise-looking point estimate can be unreliable when the relationship is weak.
Benchmark and Data Choices
Before comparing beta estimates, align:
- benchmark index or factor
- total-return versus price-return series
- local-currency versus base-currency returns
- daily, weekly, or monthly frequency
- start and end dates
- treatment of dividends, fees, and corporate actions
- use of raw returns versus excess returns
- estimation method and outlier handling
A U.S. stock can have different betas relative to a domestic equity index, a global equity index, or an industry index. None is universally correct; the useful benchmark is the one relevant to the analysis.
Thin trading and stale prices can depress measured covariance. A short lookback may produce an unstable estimate, while a long lookback may mix obsolete business models, leverage, or market regimes.
Portfolio Beta
For a linear portfolio measured against one benchmark, portfolio beta can be estimated as the weighted sum of position betas:
This is most useful when weights and beta estimates use consistent data and definitions. Options, leverage, short positions, rebalancing, and other nonlinear exposures can make beta change as prices move. Scenario analysis and factor-based risk models may then be more informative than a single static number.
Beta in CAPM
CAPM uses beta to connect expected return with exposure to market risk:
The model assumes that market beta is the relevant priced risk. In practice, realized returns can reflect multiple factors, changing exposures, estimation error, taxes, liquidity, and market frictions. CAPM is therefore a model-based framework, not proof that an asset with higher beta will earn a higher realized return.
Risks and Limitations
- Historical estimate: past co-movement may not continue.
- Benchmark dependence: a different benchmark can produce a different beta.
- Model dependence: a single linear factor may omit important exposures.
- Instability: leverage, operations, capital structure, and market regimes can change beta.
- Tail blindness: beta does not describe maximum loss, drawdown, skew, or loss severity beyond a threshold.
- Path blindness: the order and timing of returns are not captured.
- Liquidity blindness: a low-beta asset can still be difficult or expensive to sell.
- False precision: estimates should be reviewed with uncertainty statistics and data quality.
Common Mistakes
- Treating beta as total volatility.
- Calling beta above 1 evidence that an asset will outperform.
- Comparing betas calculated against different benchmarks or periods.
- Applying an equity beta to a materially changed capital structure without review.
- Ignoring low R-squared or a wide confidence interval.
- Assuming beta remains constant in stressed markets.
- Confusing market beta with the beta probability distribution or a Type II statistical error.
Authoritative Context
- Investor.gov: Beta
- FINRA: Volatility and Beta Basics
- Federal Reserve: A Robust Capital Asset Pricing Model
- NIST: Mean Vector and Covariance Matrix
Related Terms
- Capital Asset Pricing Model: Uses beta to estimate a model-based required return for market risk.
- Systematic Risk: The broad market-related risk that beta is intended to represent.
- Correlation: Standardizes co-movement but does not incorporate the relative volatility used in beta.
- Covariance: Forms the numerator of the conventional beta calculation.
- Standard Deviation: Measures total return dispersion rather than benchmark-relative sensitivity.
FAQs
Is a beta below 1 a low-risk investment?
Can beta be negative?
Does beta predict the next market move?
Educational Use
This article provides general financial education. It is not personalized investment, trading, portfolio-construction, valuation, statistical, tax, or legal advice.