Stock Quote Price Fields
Open, high, low, last-sale, unchanged, and 52-week-range fields summarize different market observations whose meaning depends on timing and methodology.
Stock quote price fields summarize different observations about an instrument: the open marks how a session began, the high and low bound eligible prices during a period, the last sale records the latest eligible transaction, unchanged compares a current field with a reference, and the 52-week range places price within a trailing-year band. These fields are related, but they are not interchangeable.
Every field needs context. The instrument, venue, session, timestamp, data delay, trade conditions, and adjustment method can change what a displayed number means. None of these fields guarantees a price available for the next order or establishes that an instrument is fairly valued.
Key Takeaways
- Open, high, low, and last are trade-derived fields, but providers can apply different session and eligibility rules.
- The opening price may come from an auction or the first qualifying trade; it is not necessarily the first pre-market price.
- High and low mark eligible extremes during a defined period, not prices available for unlimited quantity.
- Last sale is historical as soon as the trade occurs; current bid and ask show different evidence.
- Unchanged means zero change from a stated reference, not zero trading or zero volatility.
- A 52-week range is a rolling historical band, not a valuation model or price target.
- Quote screens should be checked against source definitions before fields from different venues or vendors are compared.
Price Fields at a Glance
| Field | Plain-English meaning | Essential context | What it does not establish |
|---|---|---|---|
| Opening price | Official auction price or first eligible price for a session | Venue, session, auction or first-trade method | First pre-market trade or future direction |
| High | Highest eligible price during a defined period | Period, session, trade eligibility, adjustments | Current offer, fair value, or available size |
| Low | Lowest eligible price during a defined period | Period, session, trade eligibility, adjustments | Current bid, price floor, or recovery potential |
| Last sale | Most recent eligible reported transaction | Execution time, report time, size, venue, condition | A standing quote or next execution price |
| Unchanged | Current comparison field equals its reference | Current field, reference field, precision, timestamp | No activity, no volatility, or zero total return |
| 52-week range | Trailing-year high-low band | Rolling window, price field, history, adjustments | Expected return, upside, downside, or intrinsic value |
The words can look simple because a quote screen compresses many records into a few columns. The analytical work is identifying which records qualified for each column.
Worked Quote Example
Assume a stock quote shows:
| Field | Value |
|---|---|
| Previous regular-session close | 40.00 |
| Official opening price | 40.60 |
| Session high | 41.20 |
| Session low | 39.50 |
| Last sale | 40.00 |
| Current bid / ask | 39.98 / 40.02 |
| 52-week low / high | 35.00 / 48.00 |
Several conclusions follow, but each is limited:
- The stock opened
0.60above the previous close. - Its session range so far is
41.20 - 39.50 = 1.70. - The latest eligible trade equals the previous close, so the displayed net change can be
0.00, or unchanged. - The live displayed market is the
39.98bid and40.02ask, not the40.00last sale. - Using the displayed last sale, the stock is about
38.5%of the way from its 52-week low to its 52-week high:
Range position = (40 - 35) / (48 - 35) × 100 = 38.5%
That result does not mean the stock has 61.5% upside or a 38.5% probability of rising. It describes location within one historical price band.
What Is the Opening Price?
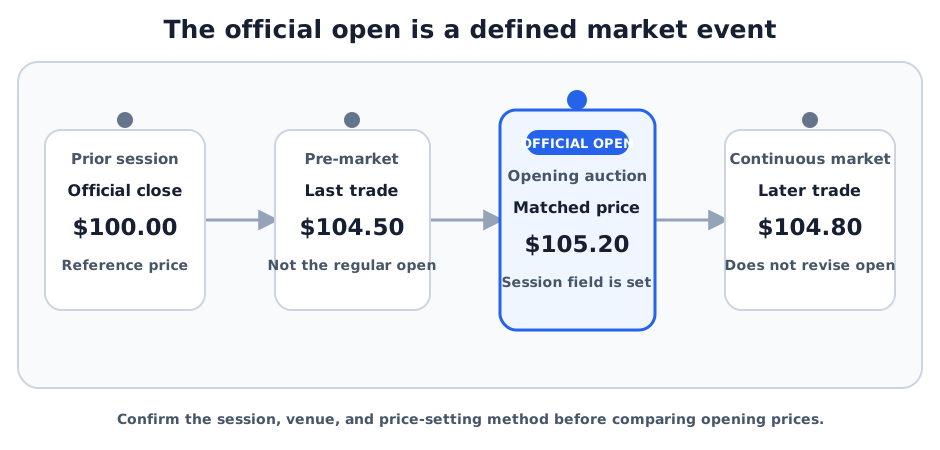
The opening price is the official auction price or first eligible transaction used to establish where an instrument begins a defined trading session. The method depends on the market.
Opening Auction or First Eligible Trade
An exchange opening auction can aggregate eligible buy and sell orders and execute them together at one price. Auction information may include an indicative match price, paired quantity, imbalance, reference price, and collars. Those values can change before the auction completes, so an indication is not the official opening execution.
If an opening cross does not occur, a venue or data product may use the first qualifying regular-session trade. A vendor can also publish a derived opening field under its own methodology. These methods need not produce identical observations.
| Event | Example price | Interpretation |
|---|---|---|
| Prior regular-session close | 100.00 | Historical reference from the previous session |
| Pre-market trade | 104.50 | Completed trade in an earlier session |
| Indicative auction price | 105.00 | Provisional calculation, not an execution |
| Official opening auction | 105.20 | Opening price established by the venue |
| Later continuous trade | 104.80 | New transaction after the open |
For this example, 105.20 is the official open. The pre-market trade does not replace it, and the later trade does not revise it.
Delayed Openings and Reopenings
A security can open after the market’s standard start because of news, an order imbalance, a trading halt, an initial listing, or an operational issue. A reopening auction after a halt is a new price-discovery event, but a data product may keep it separate from the day’s original opening price.
A market-on-open order requests participation in the opening process without specifying a limit price. A limit-on-open order participates only at the limit price or better. Eligibility, cutoffs, priority, and cancellation rules depend on the venue. Neither instruction guarantees a fill or removes the risk of a price far from the prior close.
What Do High and Low Mean?
The high is the highest eligible trade price during a stated period, and the low is the lowest. Together they define the period’s observed price range.
| Label | Measurement window | Question it answers |
|---|---|---|
| Session high or low | Current trading session | What are the eligible extremes so far? |
| Daily high or low | Completed trading day | What were the day’s eligible extremes? |
| Weekly or monthly high or low | Calendar or rolling period | What were the extremes during that interval? |
| 52-week high or low | Trailing-year window | What are the recent historical boundaries? |
| All-time high or low | Full comparable history | What are the recorded extremes in the available series? |
| Life-of-contract high or low | One futures maturity | What are that contract’s extremes since listing? |
Session High-Low Example
Suppose the eligible regular-session trades are:
| Time | Price | Shares |
|---|---|---|
| 9:35 a.m. | 49.80 | 1,200 |
| 10:20 a.m. | 51.10 | 100 |
| 12:45 p.m. | 50.60 | 4,500 |
| 3:50 p.m. | 50.90 | 2,000 |
The high is 51.10 and the low is 49.80. Only 100 shares traded at the high in this example, so that field does not prove a larger order could have sold at 51.10.
If an after-hours trade later occurs at 52.00, one service may display 52.00 as an extended-hours high while retaining 51.10 as the regular-session high. Mixing the two session definitions would create a false comparison.
Trade Eligibility Matters
Not every disseminated transaction necessarily updates high, low, or last-sale statistics. Applicable reporting rules and condition codes can treat late, corrected, canceled, prior-reference, average-price, or other specially marked transactions differently.
FINRA’s trade-reporting FAQs, for example, explain that certain reports do not affect high-low-last-sale statistics. This is a reason to check a feed’s field methodology rather than reconstructing official fields from an unfiltered list of prints.
“Record high” and “record low” also require a stated dataset. A record closing high differs from a record intraday high, and a recently listed security does not have the same history as a long-running index series.
What Is Last Sale?
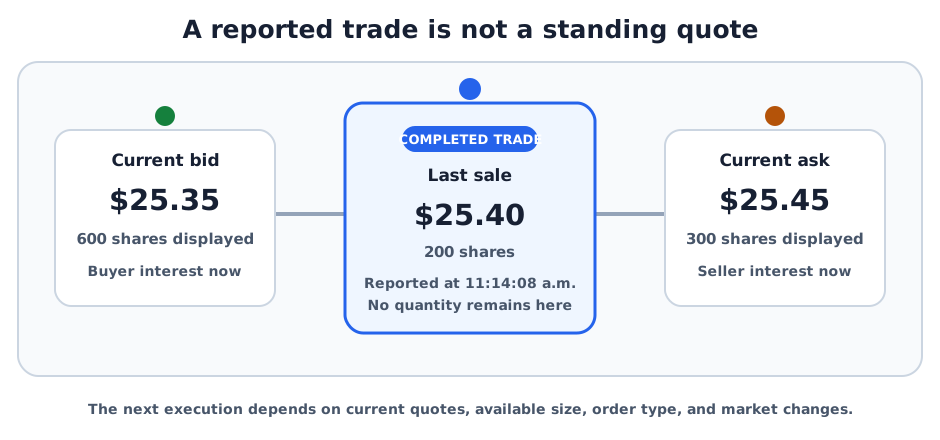
The last sale price is the price of the most recent eligible reported transaction. It records an execution that already occurred. It is not an order waiting to trade.
A useful last-sale record includes:
- instrument identifier and share class or contract maturity;
- execution price and quantity;
- execution time and report time;
- venue or reporting facility;
- regular- or extended-hours status;
- sale-condition or correction indicators; and
- whether the feed is real-time, delayed, or end-of-day.
Last Sale vs. Bid and Ask
Assume a screen shows:
| Field | Price | Size |
|---|---|---|
| Bid | 25.35 | 500 shares |
| Last sale | 25.40 | 200 shares traded |
| Ask | 25.45 | 300 shares |
The last sale proves that 200 shares traded at 25.40 at the recorded time. The bid and ask show later displayed interest. A new market order could execute at a different price if quotes move, available size is insufficient, hidden liquidity interacts with the order, or the order reaches another venue.
A last sale can also appear outside the current spread because quotes moved after the trade, the report arrived late, or the transaction has a special condition. Time and condition data should be compared before calling the display erroneous.
Last Sale Is Not Closing Price or Settlement
The most recent trade, official closing price, and settlement price can differ:
- A stock’s official close may come from a closing auction rather than the final extended-hours print.
- A futures exchange can calculate settlement under a stated method rather than use the last trade.
- A thinly traded bond’s last disseminated transaction can be stale relative to current dealer interest.
- A traditional mutual fund generally publishes a calculated net asset value rather than a continuous last sale.
- An index level is a calculation, not a transaction in the index itself.
When reviewing a personal execution, use the order ticket, broker acknowledgment, execution report, confirmation, and contemporaneous market data. A public quote screen cannot establish every routing or fill detail.
What Does Unchanged Mean?
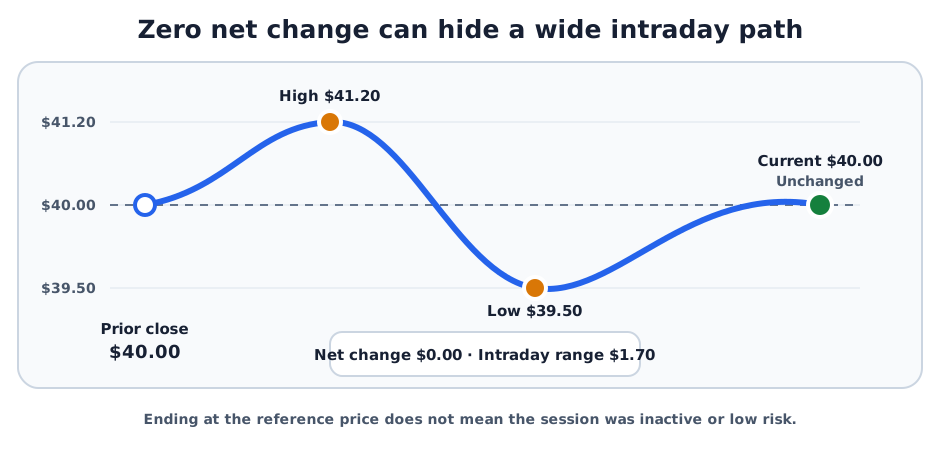
An unchanged price means the selected current value equals its stated reference under the displayed precision. It is a point-to-point result, not a description of everything that happened between those points.
The basic calculations are:
Net change = current comparison price - reference price
Percentage change = (current comparison price - reference price) / reference price × 100
If the current price and reference are both 40.00, net change is 0.00 and percentage change is 0%. Yet the instrument could have traded heavily, reached a high of 41.20, fallen to 39.50, and returned to 40.00.
The Reference Must Be Named
| Current field | Possible reference | Meaning |
|---|---|---|
| Last sale | Prior regular-session close | Latest eligible trade equals the previous close |
| Official close | Previous official close | Two consecutive official closes are equal |
| Futures settlement | Previous settlement | Exchange settlement did not change |
| Bid or ask | Previous quote | One side of the quote is unchanged |
| Index level | Previous published close | Calculated level equals its reference |
| Net asset value | Previous NAV | Fund value per share is unchanged |
“Unchanged from the open,” “unchanged on the day,” and “unchanged from the previous tick” are different statements.
Rounding can also create an unchanged display. Data services can calculate change from full-precision values and then round the result, or round the two displayed values before comparison. Rates, indexes, foreign-exchange quotes, and low-priced securities can be sensitive to this choice.
Price unchanged does not necessarily mean total return is zero. Dividends, interest, distributions, transaction costs, currency translation, and taxes can produce a different economic result.
What Is the 52-Week Range?
The 52-week range is the band between an instrument’s highest and lowest eligible prices during a trailing-year window. It is normally rolling, so the oldest observation can leave the window as each new trading day enters.
Range Position
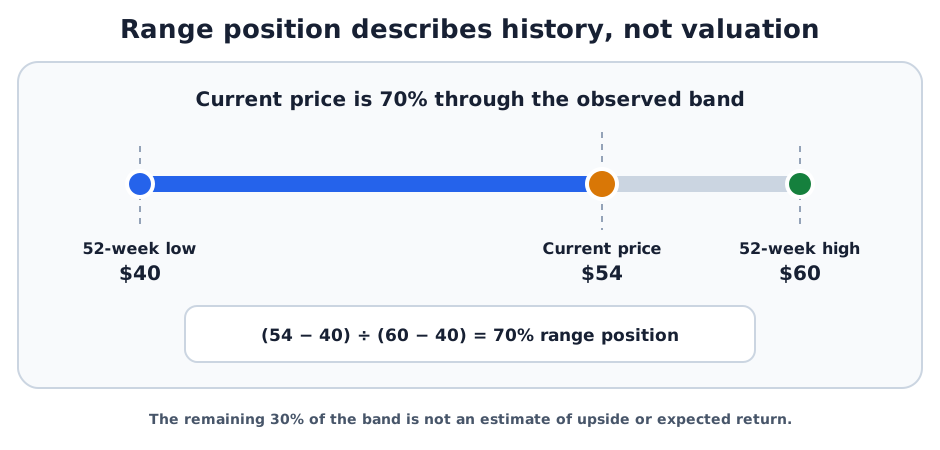
A common normalized calculation is:
Range position = (current price - 52-week low) / (52-week high - 52-week low) × 100
If the low is 40, the high is 60, and the current price is 54:
(54 - 40) / (60 - 40) × 100 = 70%
The current price is 70% of the way from the observed low to the observed high. It is not “70% overvalued,” and the remaining 30% is not forecast upside.
If high equals low, the denominator is zero and range position is undefined. A newly listed, suspended, or rarely traded instrument can also have less than a full year of meaningful history.
Why Providers Can Disagree
A 52-week field can use:
- intraday trades or official closes;
- regular-session or extended-hours observations;
- split-adjusted, distribution-adjusted, or unadjusted prices;
- a trailing 52-week, trailing 365-day, or vendor-defined window;
- one futures maturity or a vendor-created continuous contract; and
- corrected or filtered trade records under different eligibility rules.
A former high or low can change without a new extreme when the old observation rolls out of the window or historical prices are adjusted after a corporate action.
Session, Source, and Adjustment Checks
Before comparing any price fields, identify:
- Instrument: ticker, full identifier, share class, exchange, currency, and contract maturity.
- Field: trade, quote, auction, close, settlement, NAV, index level, or vendor calculation.
- Session: regular, pre-market, after-hours, overnight, or combined.
- Period: current session, trading day, calendar interval, rolling year, or full history.
- Source: primary venue, consolidated feed, reporting facility, broker, or vendor.
- Time: execution timestamp, report timestamp, delay, time zone, and measurement cutoff.
- Eligibility: trade conditions, corrections, cancellations, and statistical update rules.
- Adjustment: splits, distributions, mergers, contract rolls, and index-methodology changes.
- Liquidity: trade size, quote size, spread, depth, and age of the last sale.
Comparisons are most defensible when all fields use the same instrument, session, period, and methodology.
Asset-Class Differences
| Market | Common fields | Important distinction |
|---|---|---|
| Exchange-listed stocks and ETFs | Open, high, low, last, close, volume, 52-week range | Auctions, extended hours, trade conditions, and fragmented venues matter |
| Futures | Open, high, low, settlement, change, lifetime high-low | Fields are contract-specific; settlement can differ from last trade |
| Corporate and agency bonds | Last trade, yield, volume, dealer indications | Last trades can be stale and are not current dealer quotes |
| Mutual funds | NAV, prior NAV, daily change | NAV is calculated at a valuation time, not continuously traded |
| Indexes | Open, high, low, close, change | Index levels are calculations, not executions in the index |
| Foreign exchange | Bid, ask, midpoint, session high-low | The decentralized market and provider cutoff define the session |
The CFTC’s futures-table guide illustrates why labels should not be transferred mechanically between markets: it distinguishes open, high, low, settlement, change, and lifetime extremes for each contract maturity.
How to Evaluate a Quote Screen
Use this workflow:
- Confirm that the symbol and full instrument identity match the intended security or contract.
- Check whether the feed is real-time, delayed, end-of-day, or historical.
- Identify the market session and the provider’s opening, closing, high-low, and 52-week methodologies.
- Separate completed trades from current bid and ask quotations.
- Inspect timestamps, size, venue, and condition codes when a print looks unusual.
- Check corporate actions and whether historical values are adjusted.
- Compare fields from the same source and session before investigating vendor differences.
- Use order and execution records, not summary fields, for a transaction-specific conclusion.
Common Mistakes and Risks
- Treating last sale as executable: the available bid, ask, and depth may already have changed.
- Calling pre-market activity the official open: the regular-session open can be a later auction result.
- Mixing regular and extended sessions: highs, lows, and changes become incomparable.
- Assuming a high is resistance or a low is support: historical extremes do not constrain future prices.
- Treating a 52-week low as cheap: historical location does not measure intrinsic value.
- Calling distance to the high “upside”: the old high is not a target or expected return.
- Interpreting unchanged as calm: a security can travel through a wide range and finish at its reference.
- Ignoring small or stale prints: one transaction may not represent meaningful executable size.
- Mixing close, settlement, and last sale: these fields follow different methods.
- Ignoring adjustments: splits, distributions, and contract rolls can distort comparisons.
- Using quote summaries as personalized advice: price fields describe market records, not suitability.
Sources and Further Reading
- Investor.gov: Stock Quotes identifies bid and offer fields and historical open, close, high, low, and volume data.
- Investor.gov: Closing Price distinguishes regular-session closing prices from after-hours activity.
- FINRA: Trade Reporting Frequently Asked Questions explains how reporting timing and modifiers can affect high-low-last-sale statistics.
- CFTC: How to Read Futures Price Tables distinguishes open, high, low, settlement, change, and lifetime fields for futures contracts.
- Nasdaq: Opening and Closing Crosses describes exchange auction schedules and on-open order types.
- NYSE: Auctions provides opening and closing auction information, including imbalance and indicative-price fields.
FAQs
Is the opening price the first trade of the day?
Is the last sale the current market price?
Can a stock be unchanged after a volatile day?
Does a 52-week high mean a stock is overvalued?
Why do two quote services show different highs or lows?
Related Terms
- Stock Quotes: Quote screens, timing labels, and the difference between transaction and executable-price fields.
- Market Data: Sources, distribution, identifiers, tickers, and tape records.
- Trading Volume: Completed activity during a selected interval.
- OHLC Chart: Chart format using open, high, low, and close observations.
- Opening Range: High-low band observed during a chosen interval after a session begins.
- New Highs and New Lows: Security-level extremes and aggregate market-breadth counts.
Educational Use
This article is for financial education only. It does not provide personalized investment, trading, legal, tax, or regulatory advice; recommend a security or strategy; or determine whether a displayed market price is suitable for a particular transaction.