Price Gap
A price gap is an interval between trading periods where no eligible trades occur, creating execution and chart-interpretation risks.
A price gap is an interval between two trading periods where no eligible trades occur at the prices in between. On a chart, it appears when the next period opens above or below a prior reference price or range. Price gaps are common after news, earnings releases, economic data, trading halts, and other events that change orders before continuous trading resumes.
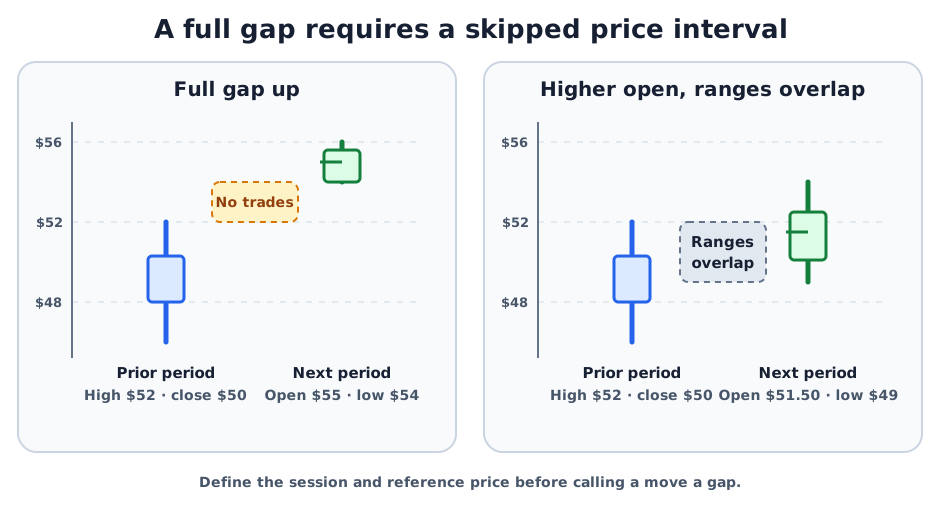
The reference matters. A close-to-open gap compares the new opening price with the previous close. A full-range gap requires the new period’s range to sit entirely above the prior high or below the prior low. Those are not the same measurement.
Key Takeaways
- A gap describes a discontinuity in reported trading, not a guaranteed change in fundamental value.
- State the instrument, venue, session, data source, and reference price before measuring a gap.
- An opening price above the previous close is not necessarily a full gap above the previous trading range.
- Gaps can increase slippage because market and stop orders execute against available prices, not skipped chart levels.
- A gap does not have to be filled, and the label alone does not predict continuation or reversal.
- Corporate actions and inconsistent adjusted data can create apparent gaps that are not ordinary market moves.
How a Price Gap Is Measured
The simplest close-to-open measurement is:
opening price - previous closing price
If a stock closes at 50.00 and opens at 54.00, the close-to-open gap is +4.00, or +8% relative to the prior close.
A stricter chart definition compares complete ranges:
| Gap test | Condition | What it means |
|---|---|---|
| Full gap up | Current low is above the prior high | No reported trade ranges overlap |
| Full gap down | Current high is below the prior low | No reported trade ranges overlap |
| Partial gap up | Current open is above the prior close, but ranges overlap | The opening changed, but some prices overlap |
| Partial gap down | Current open is below the prior close, but ranges overlap | The opening changed, but some prices overlap |
The measurement can change if one chart includes extended-hours trades and another uses regular-session data only. Futures charts can also differ because of session definitions, contract rolls, and whether the chart uses settlement or last-trade prices.
Why Gaps Occur
Prices can gap when the set of willing buyers and sellers changes while ordinary trading is closed or interrupted. Common causes include:
- issuer earnings, guidance, financing, merger, or legal announcements;
- economic releases, central-bank decisions, or geopolitical events;
- overnight movement in related markets;
- order imbalances at an opening auction;
- reopening after a trading halt;
- thin liquidity, especially in extended hours or less active instruments; and
- splits, distributions, ticker changes, or futures rolls that affect chart data.
The cause should be checked rather than inferred from the shape alone. A chart cannot show whether the move reflects new information, a corporate action, a small isolated trade, or a data adjustment.
Common Technical Labels
Technical analysts often use four descriptive labels:
| Label | Typical chart context | Main limitation |
|---|---|---|
| Common gap | Small discontinuity inside an established range | May reflect ordinary noise or thin liquidity |
| Breakaway gap | Price leaves a consolidation area | Follow-through is not guaranteed |
| Runaway or continuation gap | Gap appears during an established trend | The label may be assigned only after later prices are known |
| Exhaustion gap | Gap appears late in an extended move | A reversal cannot be confirmed from the gap alone |
These classifications are interpretations, not exchange-defined events. Two analysts can classify the same gap differently because they use different lookback periods, chart sessions, or trend rules.
What Does “Filling the Gap” Mean?
A gap is said to fill when later trading returns into the skipped interval. A complete fill usually means price trades through the entire interval to the opposite boundary. A partial fill means price enters the interval but does not cross all of it.
For a full gap up from a prior high of 52.00 to a current low of 53.00, trading down to 52.60 would partially fill the gap. Trading to 52.00 would completely fill it under that definition.
There is no rule requiring a gap to fill. Some close quickly, some remain visible for years, and some disappear from adjusted charts after corporate-action corrections. Treating “gaps always fill” as a certainty ignores time horizon, opportunity cost, and the possibility of further losses.
Price Gap vs. Related Terms
| Term | What it describes | Important distinction |
|---|---|---|
| Price gap | Prices skipped between periods or sessions | Requires a stated reference and session |
| Opening Price | First official or eligible price of a session | One price does not show whether ranges overlap |
| Opening Range | High-low band during a chosen early-session window | Describes a range after the open |
| Breakout | Price moving beyond a defined boundary | Can occur continuously without a gap |
| Bid-Ask Spread | Difference between the best displayed bid and ask | Exists at one point in time, not between chart periods |
| Execution | Process that turns an order into completed trades | Actual fills can differ from expected prices |
Execution Risks and Limitations
| Risk | Why a gap matters | Check before acting |
|---|---|---|
| Market-order risk | Execution price is not guaranteed | Current quotes, spread, depth, and order size |
| Stop-order risk | A stop can trigger after price has moved through the stop level | Trigger rules and likely liquidity after activation |
| Stop-limit risk | Price control can prevent execution entirely | Limit price and consequences of an unfilled order |
| Extended-hours risk | Liquidity may be lower and volatility higher | Session eligibility, venues, and allowed order types |
| Data risk | Session settings or adjustments can create different gaps | Official prices, timestamps, corporate actions, and vendor rules |
| Pattern risk | Gap labels can encourage unsupported forecasts | News, volume, follow-through, and predefined loss limits |
Investor.gov notes that a market order prioritizes execution but does not guarantee the execution price, while a stop order becomes a market order after its trigger. FINRA also warns that extended-hours markets can have lower liquidity, higher volatility, and prices that differ from the next regular-session open. These mechanics are why a visible gap can produce an execution result far from a planned level.
How To Evaluate a Price Gap
- Identify the exact instrument, exchange or venue, timezone, and trading session.
- Define whether the comparison uses prior close, settlement, high, low, or an extended-hours price.
- Confirm that both periods use consistent adjusted or unadjusted data.
- Check issuer news, economic releases, halts, auctions, and corporate actions.
- Compare volume, spread, depth, and actual trade reports near the open.
- Separate the observed gap from any continuation, reversal, or gap-fill hypothesis.
- If an order is involved, document the order type, position size, acceptable loss, and unfilled-order risk.
This page is for financial education only. It does not provide personalized investment, trading, tax, legal, or regulatory advice, and it does not recommend a gap-trading strategy.
Sources and Further Reading
- Investor.gov: Types of Orders
- Investor.gov: Executing an Order
- FINRA: Extended-Hours Trading—Know the Risks
- FINRA: Trading Halts, Delays and Suspensions
FAQs
Is a gap up automatically bullish?
Do all price gaps eventually fill?
Can a chart show a false gap?
Can price gaps occur outside stocks?
Related Terms
- Opening Price: First official or eligible price of a trading session.
- Opening Range: High-low band formed during a defined early-session window.
- Breakout: Move beyond a stated price boundary.
- Stop Order: Order that becomes a market order after its trigger.
- Trading Volume: Completed trading activity over a selected period.
- OHLC Chart: Price chart showing each period’s open, high, low, and close.