Operating Margin
Operating margin is operating income divided by revenue. See a worked example, compare nearby margins, and learn the ratio limitations.
Operating margin is operating income expressed as a percentage of revenue. It shows how much operating profit remains from each revenue dollar after the expenses included in the company’s operating-income subtotal, but before income taxes and financing effects generally reported below that subtotal.
The ratio helps evaluate the economics of the overall operating model. It is not the same as cash margin, EBITDA margin, net profit margin, or return on invested capital.
Key Takeaways
- Operating margin equals operating income divided by revenue, multiplied by 100.
- It incorporates more of the cost structure than gross margin, including operating overhead and depreciation or amortization classified within operations.
- The precise operating-income subtotal and expense classification can vary, so use the issuer’s filed statement and notes.
- Margin expansion can result from pricing, mix, cost control, scale, classification changes, or temporary spending reductions.
- Operating margin says nothing by itself about capital expenditure, working capital, debt service, taxes, or valuation.
Operating Margin Formula
Revenue should match the period and scope of operating income. For consolidated analysis, do not divide a segment profit measure by consolidated revenue or combine a quarterly numerator with annual revenue.
Worked Example
Assume a company reports:
| Income-statement item | Amount | Percentage of revenue |
|---|---|---|
| Revenue | $10.0 million | 100% |
| Cost of goods sold | ($6.2 million) | (62%) |
| Gross profit | $3.8 million | 38% |
| Other operating expenses excluding D&A | ($2.0 million) | (20%) |
| Depreciation and amortization | ($0.5 million) | (5%) |
| Operating income | $1.3 million | 13% |
The operating margin is:
The company retains $0.13 of operating income per revenue dollar under the stated classification. The result does not mean that $0.13 was collected in cash: receivables, inventory, payables, capital spending, interest, and taxes can produce a very different cash outcome.
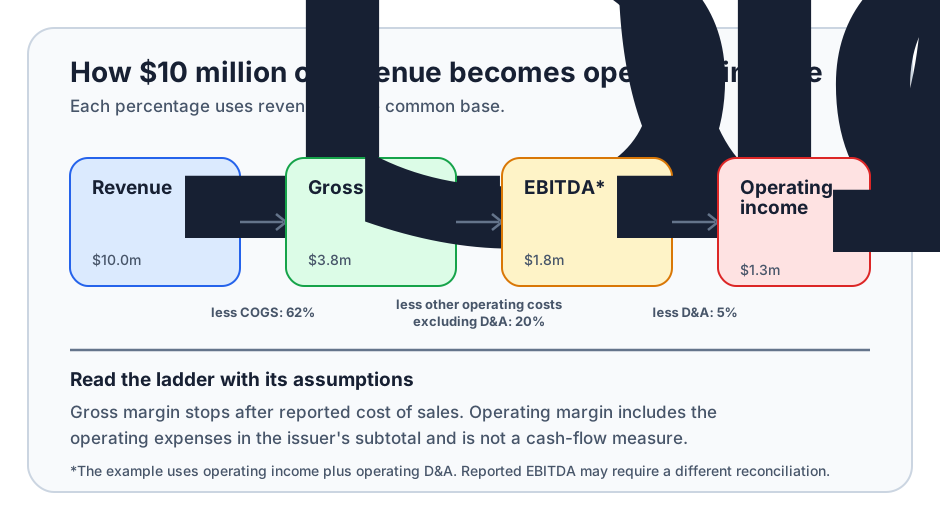
In this simplified example, adding the $0.5 million of operating depreciation and amortization to operating income produces $1.8 million, or an 18% EBITDA margin. That shortcut is valid here because the assumptions are stated; issuer-reported EBITDA should be checked through its own reconciliation.
What Operating Income Includes
Operating income commonly begins with gross profit and subtracts operating expenses such as selling, general and administrative, research and development, and depreciation and amortization. Presentation varies by business and reporting framework.
Some companies do not present a gross-profit subtotal, and some costs can appear in different rows. Depreciation may be allocated to cost of sales, operating expenses, or both. Restructuring, litigation, stock-based compensation, impairments, and gains or losses may also receive different treatment across issuers.
Read the accounting policies and notes before treating two operating margins as directly comparable.
Comparing the Margin Ladder
| Measure | Common numerator | What remains deducted | Important limitation |
|---|---|---|---|
| Gross Margin | Gross profit | Reported cost of sales | Omits overhead and other operating costs |
| EBITDA-to-Sales Ratio | Defined EBITDA | Interest, taxes, depreciation, and amortization | Usually non-GAAP and not cash flow |
| Operating margin | Operating income | Costs included in the operating subtotal | Classification can differ across issuers |
| Net profit margin | Net income | Operating, financing, tax, and most other recognized items | Can be affected by financing and one-time items |
| Operating Cash Flow Margin | Operating cash flow | Cash effects captured in operating activities | Classification and working-capital timing matter |
The percentages are analytical checkpoints, not a ranking in which one is universally superior.
What Changes Operating Margin?
Gross-margin movement. Selling prices, product mix, input costs, inventory charges, and production efficiency affect the profit available to cover overhead.
Operating leverage. Margin can expand when revenue grows faster than relatively fixed operating costs. It can contract sharply when revenue falls but those costs remain.
Investment timing. Hiring, marketing, research, maintenance, and systems spending may reduce current margin while supporting future operations. Deferring necessary spending can temporarily increase it.
Classification and adjustments. Moving a cost between cost of sales and operating expense changes gross margin but may leave operating margin unchanged. Excluding a cost from an adjusted measure can change both comparability and interpretation.
Acquisitions and currency. Acquired businesses, purchase-accounting effects, divestitures, and foreign-exchange changes can alter the margin without reflecting comparable organic performance.
How to Analyze Operating Margin
- Recalculate the ratio from the reported revenue and operating-income lines.
- Review which expenses are included in operating income.
- Compare equivalent quarterly or annual periods over several years.
- Reconcile changes to gross margin and major operating-expense categories.
- Separate organic, acquisition, currency, and classification effects where disclosed.
- Compare peers only after aligning business mix, accounting treatment, and fiscal periods.
- Test whether margin movement is supported by operating cash flow and sustainable investment.
- Review any adjusted operating margin beside the comparable reported measure and reconciliation.
Common Mistakes and Limitations
- Calling it cash profitability: operating income includes accruals and excludes important cash requirements.
- Assuming all D&A sits below gross profit: companies allocate depreciation and amortization differently.
- Equating operating income with EBIT automatically: non-operating items can make the measures differ.
- Ignoring negative margins: percentage changes become difficult to interpret when the prior-period margin is near zero or changes sign.
- Treating margin expansion as proof of quality: reduced maintenance, research, or customer support can improve the current percentage while weakening the business.
- Comparing unrelated sectors: capital intensity, pricing models, and cost classifications differ structurally.
- Ignoring dollar profit: a lower margin on a much larger revenue base can still produce more operating income.
- Using adjusted figures without reconciliation: exclusions can remove recurring operating costs.
Authoritative Sources
- SEC: Beginners’ Guide to Financial Statements
- SEC: Non-GAAP Financial Measures guidance
- FASB: Conceptual Framework
Related Terms
- Operating Income: The reported numerator commonly used in operating margin.
- Gross Margin: Gross profit divided by revenue before other operating costs.
- EBITDA: Earnings before interest, taxes, depreciation, and amortization under a defined calculation.
- Revenue: The denominator used in operating-margin analysis.
- Common-Size Statement: A statement that expresses income-statement lines as percentages of revenue.
FAQs
Is operating margin the same as EBIT margin?
Can operating margin be negative?
Does a rising operating margin guarantee stronger cash flow?
This page is educational and does not provide accounting, valuation, financing, or investment advice.