Total Debt-to-Total Assets Ratio
The debt-to-assets ratio divides defined debt by total assets. Learn the borrowing and liability variants, worked example, and limitations.
The total debt-to-total assets ratio, commonly shortened to debt-to-assets ratio, divides a defined measure of debt by total assets. It shows the share of reported assets matched by the selected debt numerator at a particular balance-sheet date.
The term is ambiguous: some analysts use interest-bearing borrowings, while others use total liabilities. Those calculations answer different questions, so the numerator should always be stated.
Key Takeaways
- Interest-bearing debt to assets measures borrowings relative to reported assets.
- Total liabilities to assets is broader and includes operating and other obligations.
- Debt to assets plus equity ratio equals 100% only when debt is defined as total liabilities.
- The ratio is a balance-sheet snapshot and does not measure interest coverage or cash available for repayment.
- Asset quality, maturity timing, collateral, leases, guarantees, and seasonal borrowing can materially change the interpretation.
Debt-to-Assets Formulas
Using interest-bearing debt:
Using all recognized liabilities:
The second measure is sometimes called a debt ratio, including in introductory materials, but liabilities-to-assets ratio is the clearer label. It prevents trade payables, deferred revenue, tax balances, and provisions from being mistaken for funded borrowings.
Worked Example
Assume a company reports:
| Balance-sheet item | Amount | Percentage of assets |
|---|---|---|
| Short-term borrowings | $100 million | 4% |
| Current portion of long-term debt | $50 million | 2% |
| Long-term debt | $750 million | 30% |
| Interest-bearing debt | $900 million | 36% |
| Other liabilities | $600 million | 24% |
| Total liabilities | $1.50 billion | 60% |
| Shareholders’ equity | $1.00 billion | 40% |
| Total assets | $2.50 billion | 100% |
Interest-bearing debt to assets is:
Total liabilities to assets is:
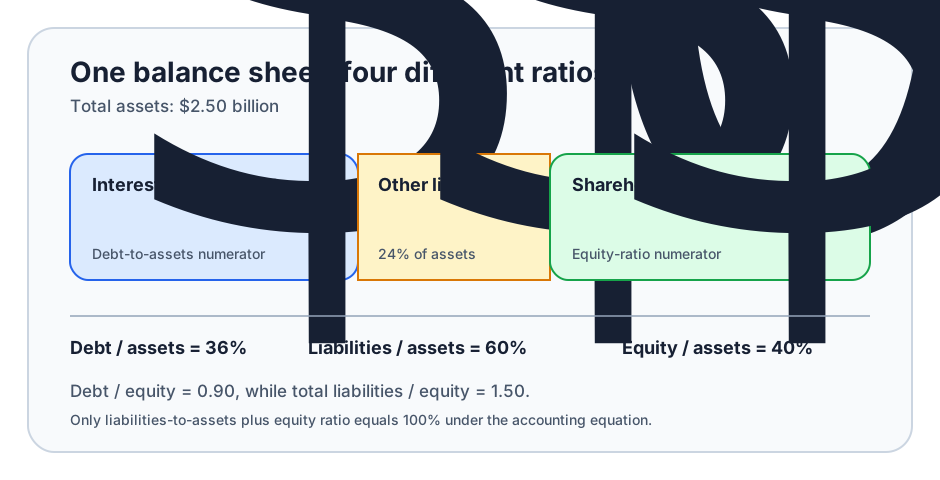
The 24-point difference consists of liabilities not classified as interest-bearing debt in this example.
Why Debt and Equity May Not Sum to Assets
The accounting equation is:
It is not generally assets = interest-bearing debt + equity. Liabilities can also include accounts payable, accrued compensation, taxes payable, contract liabilities, pension obligations, provisions, and other claims.
In the example, debt to assets is 36% and Equity Ratio is 40%. Their sum is only 76%. Adding the 24% of other liabilities completes the balance sheet.
What Counts as Debt?
A basic borrowing numerator often includes:
- bank loans and drawn revolving credit;
- commercial paper and other short-term borrowings;
- current maturities of long-term debt;
- notes, bonds, and term loans; and
- other interest-bearing financing classified as debt.
Analysts may include or separately evaluate lease liabilities, securitizations, supplier-finance arrangements, preferred instruments, pension deficits, guarantees, or other debt-like obligations. The appropriate scope depends on the question and must be applied consistently.
Netting cash creates a net debt-to-assets ratio, not the gross ratio on this page. Cash may be restricted, pledged, held in another jurisdiction, or needed for operations, so eligible cash also requires a definition.
What the Ratio Helps Explain
Balance-sheet leverage. The ratio indicates how prominent defined debt is relative to the reported asset base.
Sensitivity to asset loss. If asset carrying values decline while debt remains unchanged, debt to assets rises. Actual creditor recovery depends on realizable values, collateral, legal priority, and enforcement costs rather than the ratio alone.
Financing dependence. A debt-heavy balance sheet may be more exposed to refinancing conditions and interest rates.
Trend direction. Rising leverage can reflect borrowing, asset sales, impairments, distributions, acquisitions, or currency translation. The ratio identifies movement but not its cause.
Debt-to-Assets vs. Nearby Ratios
| Ratio | Denominator | Main perspective |
|---|---|---|
| Debt to assets | Total assets | Defined borrowings relative to the asset base |
| Liabilities to assets | Total assets | All recognized liabilities relative to assets |
| Debt-to-Equity Ratio | Book equity | Defined debt relative to the accounting equity cushion |
| Debt to capital | Debt plus equity | Debt share of defined capital |
| Long-Term Debt-to-Assets Ratio | Total assets | Long-term borrowings only relative to assets |
| Net debt to assets | Total assets | Defined debt after subtracting eligible cash |
The asset denominator can make debt to assets more stable than debt to equity when book equity is small, but it also introduces asset-quality and measurement issues.
How to Analyze Debt to Assets
- Reconcile debt to the balance sheet and debt footnote.
- State the treatment of leases, supplier finance, preferred instruments, and debt-like obligations.
- Use total assets from the same entity, currency, and reporting date.
- Compare period-end and, where useful, average balances to identify seasonal borrowing.
- Review asset composition, impairments, restrictions, collateral, and off-balance-sheet commitments.
- Map debt maturities, interest rates, fixed-versus-floating exposure, and covenant terms.
- Compare several periods and explain acquisitions, asset sales, distributions, and currency effects.
- Pair leverage with interest coverage, liquidity, operating cash flow, and free cash flow.
Common Mistakes and Limitations
- Leaving the numerator undefined: interest-bearing debt and total liabilities are not interchangeable.
- Saying debt finances the asset percentage literally: balance sheets do not trace each funding dollar to a specific asset.
- Assuming a lower ratio is automatically safer: weak cash flow, near maturities, or poor asset quality can still create risk.
- Ignoring asset carrying values: goodwill, intangibles, deferred tax assets, and impaired assets may not support debt equally.
- Omitting current maturities: long-term debt reclassified as current remains interest-bearing debt.
- Netting unrestricted and restricted cash alike: not all cash is equally available for debt reduction.
- Using one date without seasonality checks: working-capital cycles can produce temporary borrowing peaks or troughs.
- Comparing financial and nonfinancial companies mechanically: banks and insurers have sector-specific leverage and regulatory measures.
- Treating the ratio as a solvency test: it does not measure payment timing, interest burden, or access to liquidity.
Authoritative Sources
- SEC: Beginners’ Guide to Financial Statements
- Investor.gov: How to Read a 10-K or 10-Q
- FASB: Elements of Financial Statements
Related Terms
- Debt-to-Equity Ratio: Defined debt divided by book equity.
- Equity Ratio: Book equity divided by total assets.
- Debt-to-Capital Ratio: Defined debt divided by debt plus equity.
- Interest Coverage Ratio: Earnings or cash flow relative to interest obligations under a defined formula.
- Balance Sheet: The statement containing debt, asset, liability, and equity balances.
FAQs
Is debt to assets the same as liabilities to assets?
Do debt to assets and equity ratio add to 100 percent?
Can debt to assets rise without new borrowing?
This page is educational and does not provide accounting, credit, financing, legal, or investment advice.