Trend Analysis
Trend analysis compares financial data across periods to identify the direction, rate, composition, and possible drivers of change.
Trend analysis compares financial data across periods to identify the direction, rate, composition, and possible drivers of change. Analysts can study reported amounts, percentage changes, indexed values, margins, ratios, and operating measures, but a visible pattern is evidence to investigate rather than proof that the pattern will continue.
Key Takeaways
- A useful trend uses comparable periods, definitions, entities, currencies, and accounting policies.
- Absolute changes, percentage changes, index numbers, and ratios answer different questions.
- Revenue growth can coexist with margin compression, weaker cash conversion, or rising leverage.
- Base-period indexing makes differently sized series easier to compare but hides their original scale.
- Acquisitions, divestitures, inflation, seasonality, and accounting changes can create apparent trends without comparable organic performance.
Main Trend Analysis Methods
| Method | Calculation | Best used for |
|---|---|---|
| Absolute change | Current value - prior value | Measuring the dollar or unit movement |
| Percentage change | Change / prior value | Comparing relative growth when the base is meaningful |
| Trend index | Current value / base-period value x 100 | Comparing cumulative paths from a common starting point |
| Common-size trend | Line item / period base | Tracking mix, margin, or balance-sheet composition |
| Ratio trend | Consistent numerator / denominator | Studying liquidity, leverage, efficiency, or returns |
No method is sufficient alone. A 20% increase can be immaterial from a small base, while a 2% change can be important for a large cost or a covenant-sensitive metric.
Core Formulas
Absolute change is:
Percentage change is:
An indexed trend sets a selected base period to 100:
Percentage change is not meaningful in the ordinary way when the prior value is zero. It can also become misleading when the prior value is negative or unusually small. Use absolute changes and explain the sign transition instead of reporting an extreme growth rate without context.
Worked Example: Growth With Margin Pressure
Assume a company reports:
| Year | Revenue | Cost of goods sold | Gross profit | Gross margin |
|---|---|---|---|---|
| 0 | $100.0m | $60.0m | $40.0m | 40.0% |
| 1 | $110.0m | $68.2m | $41.8m | 38.0% |
| 2 | $121.0m | $76.2m | $44.8m | 37.0% |
| 3 | $133.0m | $86.5m | $46.5m | 35.0% |
Revenue rises 33% from Year 0 to Year 3, and gross profit rises by $6.5 million. However, cost of goods sold rises about 44%, and gross margin falls from 40% to 35%.
Indexing both revenue and cost of goods sold to 100 in Year 0 exposes the divergence:
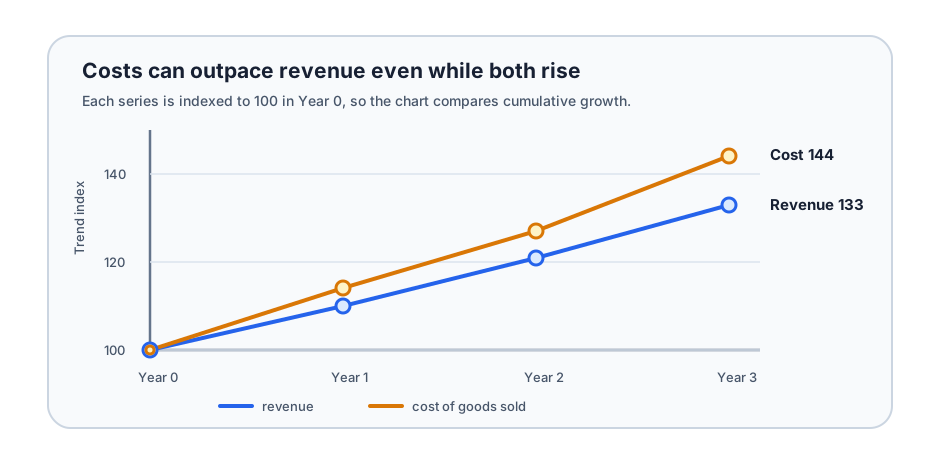
The chart does not identify the cause. Product mix, input costs, discounting, acquisition effects, currency, or classification changes could explain the pattern. The next step is to test those hypotheses against segment data, pricing, volumes, notes, and management discussion.
Trend Analysis vs. Horizontal Analysis
Horizontal analysis usually compares the same financial-statement line across periods using dollar and percentage changes. Trend analysis is broader: it can include horizontal analysis, indexed series, common-size percentages, ratios, operational drivers, and external benchmarks.
For example, horizontal analysis might show that inventory increased $20 million, or 18%, year over year. Trend analysis would place that change beside revenue, cost of sales, inventory days, write-downs, seasonality, and several prior periods to determine whether the increase is proportionate or unusual.
Combining Trend and Common-Size Analysis
A Common-Size Statement scales each line by a period-specific base. Tracking those percentages over time can show changes that absolute amounts obscure.
Useful combinations include:
- revenue growth with gross and operating margins;
- receivable growth with revenue and days sales outstanding;
- inventory growth with cost of sales and inventory days;
- debt growth with operating cash flow and interest coverage;
- capital expenditure with depreciation, capacity, and revenue; and
- share count with earnings and earnings per share.
Selecting a Time Horizon
Quarterly data can reveal turning points but is sensitive to seasonality and cutoff. Annual data reduce some noise but can hide changes within the year. Trailing periods can improve recency but may overlap heavily, making consecutive observations less independent.
Choose a horizon that fits the business cycle and question. A retailer may require same-quarter comparisons and weekly calendars; a lender may require credit-cycle data; a capital project may need several years before returns stabilize.
Making Periods Comparable
Before calculating a trend, check:
- whether periods contain the same number of weeks or months;
- whether continuing and discontinued operations are treated consistently;
- whether acquisitions and divestitures changed the reporting entity;
- whether accounting policies, estimates, or segment definitions changed;
- whether prior periods were restated or reclassified;
- whether currency translation or hyperinflation affected amounts;
- whether nominal growth mainly reflects price inflation; and
- whether unusual events distort the selected base period.
Consistency supports comparability, but uniform calculations cannot make economically different businesses identical.
How to Perform Financial Trend Analysis
- Define the decision question before selecting metrics.
- Obtain filed statements, notes, and reconciled source data.
- Align fiscal periods, units, currency, scope, and accounting definitions.
- Calculate absolute changes before percentage changes.
- Add common-size percentages and ratios that explain composition or efficiency.
- Separate price, volume, mix, acquisition, currency, and one-time effects where evidence permits.
- Compare the pattern with cash flow, balance-sheet capacity, and operating data.
- Read management’s explanation and test it against reported evidence.
- Stress alternative explanations rather than extrapolating one line mechanically.
Common Mistakes and Limitations
- Extrapolating a line: historical direction does not establish a forecast.
- Choosing a favorable base: an unusually weak or strong year can manufacture a dramatic trend.
- Ignoring denominator problems: zero, negative, or tiny prior values make percentage changes unstable.
- Mixing quarterly and annual data: unmatched periods create false comparisons.
- Ignoring acquisitions: reported growth can occur without organic improvement.
- Studying revenue alone: margins, cash conversion, capital needs, and share count can move adversely.
- Using nominal amounts over long periods: inflation can create apparent growth without higher real output.
- Treating correlation as cause: two lines moving together does not prove one drives the other.
- Overlooking restatements: databases may retain originally reported figures after filings are revised.
Authoritative Sources
- SEC: Beginners’ Guide to Financial Statements
- Investor.gov: How to Read a 10-K/10-Q
- FASB: Conceptual Framework
Related Terms
- Vertical Analysis: Scales statement lines by a common within-period base.
- Accounting Ratio: A relationship between selected financial amounts.
- Baseline in Financial Statement Analysis: The comparison point used to interpret change.
- Forecasting: A forward-looking process that may use, but should not mechanically extend, historical trends.
- Financial Statement Analysis: The broader process of evaluating reported performance and position.
FAQs
How many periods are needed for trend analysis?
Is a rising trend always positive?
Can trend analysis predict future results?
This page is educational and does not provide accounting, forecasting, credit, valuation, or investment advice.