Balance Sheet
A balance sheet reports assets, liabilities, and equity at a specific date; learn its structure, accounting equation, ratios, and analytical limits.
A balance sheet is a financial statement that reports an entity’s assets, liabilities, and equity at a specific date. It is also called a statement of financial position. The statement shows the resources recognized by the accounting framework, the claims of creditors, and the residual accounting interest attributed to owners.
Unlike an income statement or cash-flow statement, which covers activity over a period, a balance sheet is measured at a point in time. It must be read with comparative periods and the notes because one reporting date can conceal seasonality, temporary financing, restrictions, and measurement assumptions.
Key Takeaways
- The balance sheet follows the identity assets = liabilities + equity.
- Assets and liabilities may be presented as current and noncurrent or, when appropriate under the reporting framework, broadly in order of liquidity.
- Reported amounts can use different measurement bases, including historical cost, amortized cost, fair value, and amounts reduced by allowances or impairment.
- Equity is a residual accounting amount, not cash available for distribution or the market value of the company.
- A balance sheet can balance perfectly while containing classification, cutoff, valuation, omission, or disclosure errors.
- Analysts should reconcile changes in balance-sheet accounts with profit, cash flow, financing transactions, and note disclosures.
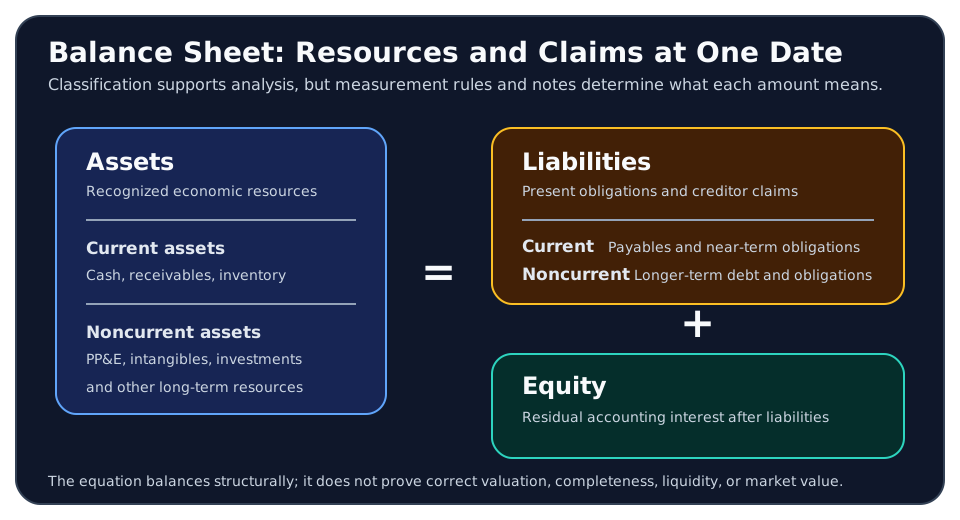
The Balance-Sheet Equation
The core accounting identity is:
It can be rearranged to show the residual nature of equity:
The equation describes statement structure, not business value. A company can report positive equity while facing cash shortages, or report negative equity while retaining valuable operations and access to financing. Recognition and measurement rules determine which resources and obligations appear and at what amount.
Main Sections
| Section | Plain-English meaning | Common line items | Questions for analysis |
|---|---|---|---|
| Current assets | Assets expected to be realized, sold, consumed, or available within the framework’s current-classification criteria | Cash, trade receivables, inventory, short-term investments, prepayments | Are balances collectible, saleable, unrestricted, and aligned with the operating cycle? |
| Noncurrent assets | Longer-term operating, financial, or other recognized resources | Property and equipment, right-of-use assets, goodwill, intangible assets, long-term investments | Which amounts depend on useful lives, impairment tests, fair values, or future forecasts? |
| Current liabilities | Obligations expected or required to be settled within the current-classification criteria | Accounts payable, accrued expenses, short-term borrowings, current debt maturities | Can operating cash flow and available financing meet near-term obligations? |
| Noncurrent liabilities | Obligations classified beyond the current period | Long-term debt, lease liabilities, pension obligations, deferred tax liabilities | What are the maturities, covenants, rates, collateral, and refinancing needs? |
| Equity | Residual interest after recognized liabilities are deducted from recognized assets | Share capital, additional paid-in capital, retained earnings, accumulated other comprehensive income, treasury stock | What changed through profit, losses, issuance, repurchases, dividends, or other comprehensive income? |
Line-item names and minimum presentation requirements differ by reporting framework and industry. Banks, insurers, investment funds, and regulated utilities often have statements that look different from those of manufacturers or retailers.
Classified vs. Liquidity Presentation
A classified balance sheet separates current and noncurrent assets and liabilities. This format helps readers assess working capital, short-term obligations, and the operating cycle.
Some entities, particularly financial institutions, may present assets and liabilities broadly in order of liquidity when that provides more reliable and relevant information under the applicable framework. A reader should not force a current-ratio interpretation onto a statement designed around liquidity ordering.
Current does not simply mean “within one year.” Under IAS 1, for example, the operating cycle, trading purpose, expected realization or settlement, cash restrictions, and rights existing at the reporting date all affect classification. Other frameworks have their own requirements.
Account Form vs. Report Form
A balance sheet can use different visual layouts without changing the accounting equation or recognition requirements.
| Layout | Structure | Interpretation |
|---|---|---|
| Account form or horizontal form | Assets appear in one column and liabilities plus equity in a parallel column | Visually emphasizes that assets equal the claims against them |
| Report form or vertical form | Assets, liabilities, and equity appear in one stacked sequence | Fits conventional reports, digital filings, and narrow screens |
These labels describe presentation, not analysis. Horizontal analysis compares the same financial-statement line across periods, while vertical analysis expresses lines as percentages of a common within-period base. A side-by-side balance-sheet layout does not perform horizontal analysis merely because its columns are arranged horizontally.
Whichever layout is used, totals, classifications, comparative dates, units, and notes should remain clear. Modern filings and responsive websites may transform the visual arrangement without changing the underlying statement.
Worked Example
Assume a simplified company reports the following year-end balances in thousands of dollars:
| Assets | Amount | Liabilities and equity | Amount |
|---|---|---|---|
| Cash | $120 | Accounts payable | $170 |
| Trade receivables | 180 | Short-term borrowings | 80 |
| Inventory | 250 | Long-term debt | 500 |
| Property, plant, and equipment, net | 650 | Shareholders’ equity | 450 |
| Total assets | $1,200 | Total liabilities and equity | $1,200 |
The statement balances:
Several preliminary measures can be calculated:
Working Capital
Current assets are cash, receivables, and inventory. Current liabilities are accounts payable and short-term borrowings. Positive working capital does not establish strong liquidity: inventory may be slow-moving, receivables may be overdue, and cash may be restricted.
Current Ratio
The ratio must be compared with the company’s operating cycle, industry, seasonality, credit facilities, and asset quality. A higher ratio is not universally better.
Liabilities to Assets
This broad leverage measure includes trade obligations as well as interest-bearing debt. It answers a different question from debt-to-equity or net-debt ratios.
The example is only a starting point. The notes must show debt maturities, receivable allowances, inventory accounting, PP&E depreciation, restrictions, commitments, and contingencies before a reliable conclusion can be made.
How the Statements Connect
Financial statements articulate with one another:
- Income statement: profit or loss generally changes retained earnings after owner distributions and other equity movements.
- Cash-flow statement: operating, investing, and financing cash flows explain the period’s change in cash, subject to exchange-rate and classification reconciliations.
- Statement of changes in equity: reconciles share issuance, repurchases, distributions, profit, other comprehensive income, and other equity movements.
- Notes: explain recognition, measurement, disaggregation, restrictions, maturities, estimates, risks, and commitments behind condensed balance-sheet lines.
A balance-sheet movement is not automatically a cash flow. Depreciation reduces PP&E and profit without a current-period cash payment; acquiring equipment through a lease can create an asset and liability without an initial cash purchase; translating foreign operations can change reported balances through other comprehensive income.
How Analysts Read a Balance Sheet
Liquidity
Review unrestricted cash, receivable collection, inventory conversion, current obligations, committed credit, covenant headroom, and near-term refinancing. Static ratios should be tested against cash-flow timing.
Asset quality
Ask how amounts are measured and recovered. Receivables depend on collection, inventory on sale or use, PP&E on productive service, goodwill on future cash-generating units, and deferred tax assets on future taxable income.
Leverage and claim priority
Separate operating liabilities from interest-bearing debt, and identify secured debt, guarantees, leases, subordinated claims, maturities, variable rates, and covenant terms. Netting cash against debt can be misleading when cash is restricted or trapped in another entity.
Capital intensity
Compare PP&E, capital expenditure, depreciation, maintenance needs, and asset turnover. A large asset base can represent productive capacity, but it can also create fixed costs, financing requirements, and impairment exposure.
Equity quality
Trace retained earnings, accumulated losses, other comprehensive income, treasury stock, noncontrolling interests, and preferred claims. Book equity can be sensitive to historical transactions and accounting methods.
Measurement Bases Matter
Not every balance-sheet amount has the same meaning.
| Measurement feature | Example | Analytical implication |
|---|---|---|
| Historical or depreciated cost | Many PP&E balances | Carrying amount can differ substantially from replacement cost or market value |
| Amortized cost | Many debt instruments and receivables | Credit allowances, effective interest, and contractual cash flows matter |
| Fair value | Selected financial instruments and investment property under applicable policies | Market inputs, model assumptions, and income-statement or OCI effects require review |
| Net realizable value | Inventory under relevant standards | Selling price, completion cost, and selling cost estimates affect recovery |
| Impairment-adjusted amount | Goodwill, intangibles, PP&E, and financial assets | Forecasts, discount rates, collateral, and reversals can affect comparability |
Adding these amounts produces a required accounting total, but not a single current market valuation of the business.
Common Red Flags
- Receivables or inventory rising much faster than revenue.
- Short-term borrowing used to finance long-lived assets without stable refinancing.
- Large acquisition goodwill with weak post-acquisition performance.
- Repeated impairment charges or changes in useful lives and residual values.
- Restricted cash presented without clear explanation.
- Debt classified as noncurrent despite covenant or refinancing uncertainty that warrants closer review.
- Large supplier-finance, guarantee, lease, pension, or legal exposures understood only through the notes.
- Material quarter-end transactions that reverse soon after the reporting date.
- Equity growth driven mainly by new share issuance rather than retained operating results.
A red flag is a prompt for investigation, not proof of misstatement or distress.
Limitations
- The statement is a snapshot and may not represent average balances during the period.
- Accounting recognition can omit internally generated resources that contribute to market value.
- Estimates and measurement methods reduce direct comparability.
- Consolidated totals can hide differences among subsidiaries, currencies, legal entities, and restricted pools of assets.
- Off-balance-sheet commitments and contingencies may be economically important.
- Inflation and changing replacement costs can make older cost-based amounts difficult to interpret.
- A balanced statement does not establish completeness, authorization, correct valuation, or proper cutoff.
Authoritative Sources
The IFRS Foundation’s IAS 1 overview describes the statement of financial position and complete financial-statement set. IFRS 18 replaces IAS 1 for annual periods beginning on or after January 1, 2027, with earlier application permitted; the IFRS Foundation’s primary financial statements project explains that transition.
The FASB Conceptual Framework explains why information about assets, liabilities, and equity helps users assess liquidity, financial flexibility, resources, obligations, and risk, while not itself showing the value of a business. Investor.gov’s How to Read a 10-K identifies the audited financial statements and accompanying filing context available to U.S. public-company investors.
Related Terms
- Accounting Equation: The structural identity connecting assets, liabilities, and equity.
- Income Statement: Reports financial performance over a period.
- Cash-Flow Statement: Explains cash inflows, outflows, and reconciliation over a period.
- Shareholder Equity: The owners’ residual accounting interest.
- Working Capital: Current assets less current liabilities.
- Book Value: An accounting net-asset measure derived from the balance sheet.
FAQs
Why is a balance sheet called a snapshot?
Does a balanced balance sheet mean the accounts are correct?
Can a profitable company have a weak balance sheet?
This article is for financial education only and is not accounting, audit, legal, tax, valuation, or investment advice. Presentation and measurement depend on the applicable reporting framework and entity facts.